Figures & data
PCR primer sequences.
Primer sequences.
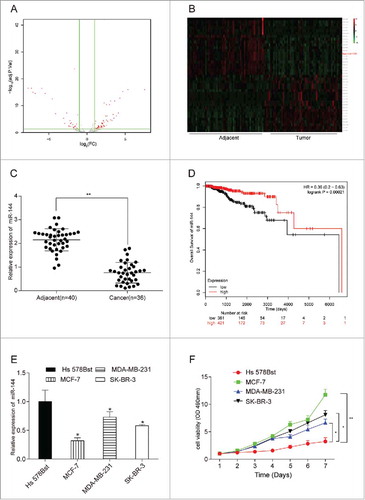
MiR-144 was low-expressed in breast cancer tissues and cells. (A) The volcano plot showed the relationship between fold change and significance of miRNAs expression. (B) The heat map of 20 high-expressed miRNAs and 20 low-expressed ones in breast cancer. (C) The expression level of miR-144 in cancer tissues was significantly low. **P < 0.01, compared with adjacent tissues, number of adjacent tissue = 40, number of cancer tissue = 36. (D) Higher miR-144 expression was related to higher survival rate. (E) MiR-144 expression was down-regulated in breast cancer cells, especially in MCF7. *P < 0.05, compared with normal breast cells. (F) MCF7 cell line had the highest cell proliferation ability. *P < 0.05, **P < 0.01, compared with Hs 578Bst cell line.
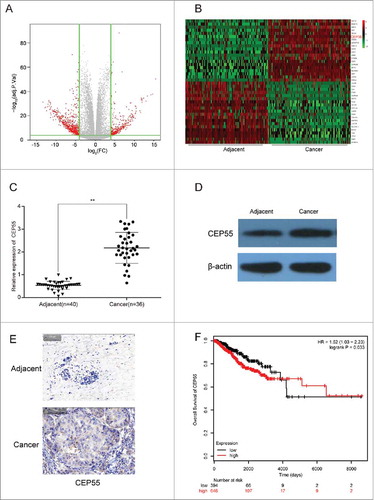
CEP55 was up-regulated in breast cancer tissues and cells. (A) The volcano plot showed the relationship between fold change and significance of mRNAs expression. (B) The heat map showed the top 20 high-expressed and 20 low-expressed mRNAs in breast cancer. (C) QRT-PCR assay was used to detect the mRNA expression level of CEP55. The results showed that the mRNA expression level of CEP55 in cancer tissues was significantly increased.**P < 0.01, compared with adjacent tissues, number of adjacent tissue = 40, number of cancer tissue = 36. (D-E) Western blot and immunohistochemistry assays were used to detect the protein expression level of CEP55. The results revealed that CEP55 protein expression level was up-regulated in breast cancer tissues and cells. (F) Kaplan-Meier method was used to plot the 5-year survival ratio of breast cancer patients. The plot indicated that patients with high expression level of CEP55 had lower survival ratio, compared with those had low-expressed CEP55.
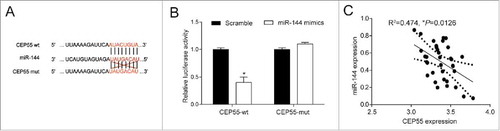
MiR-144 directly targeted at CEP55. (A) Bioinformatics method was utilized to predict the potential target of miR-144. The results showed that CEP55 wild-type's binding site matched with miR-144, suggesting that CEP55 wild-type rather than mutated-type was the target of miR-144. (B) Dual-luciferase reporter assay proved that the overexpression of miR-144 significantly down-regulated the expression of CEP55 wild-type. *P < 0.05, compared with scramble group. The expressions of CEP55 mutated-type had no difference in cells of scramble group and miR-144 mimics group. (C) CEP55 was negatively correlated with miR-144.
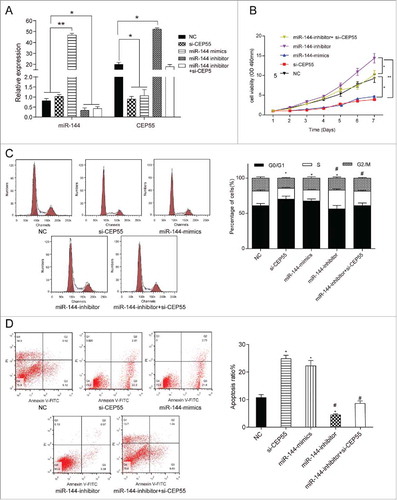
MiR-144 could inhibit proliferation, induce cell cycle arrest and promote apoptosis by down-regulating CEP55. (A) QRT-PCR assay was used to detect the expression level of miR-144 and CEP55 after transfection. The overexpression of miR-144 significantly increased the miR-144 expression level while the inhibition of miR-144 decreased the miR-144 expression level. *P < 0.05, **P < 0.01, compared with NC group and si-CEP55 group. The knockdown of CEP55 and overexpression of miR-144 could down-regulate the CEP55 expression level, while the inhibition of miR-144 could up-regulate CEP55 expression level, *P < 0.05, compared with NC group. (B) The cell proliferation ability was detected by MTT assay. MiR-144 mimics group and si-CEP55 group had the weakest proliferation ability. MiR-144 inhibitor group had the strongest cell proliferation ability, *P < 0.05, compared with NC group and miR-144 inhibitor + si-CEP55 group, **P < 0.01, compared with miR-144 inhibitor group. (C) The cell cycle was detected by FCM assay. More cells of miR-144 mimics group and si-CEP55 group were arrested in G0/G1 phase while more cells were synthesized in S phase in miR-144-inhibitor group. More cells were synthesized in S phase in miR-144-inhibitor group and miR-144-inhibitor+si-CEP55 group compared with miR-144-mimics group and si-CEP55 group. *P < 0.05, compared with NC group. # P < 0.05, compared with si-CEP55 group and miR-144 mimics group. (D) The apoptosis ratio was detected by FCM assay. MiR-144 mimics and si-CEP55 groups had the highest apoptosis ratio, and miR-144 inhibitor group had the lowest ratio. *P < 0.05, compared with NC group. # P < 0.05, compared with si-CEP55 group and miR-144 mimics group.
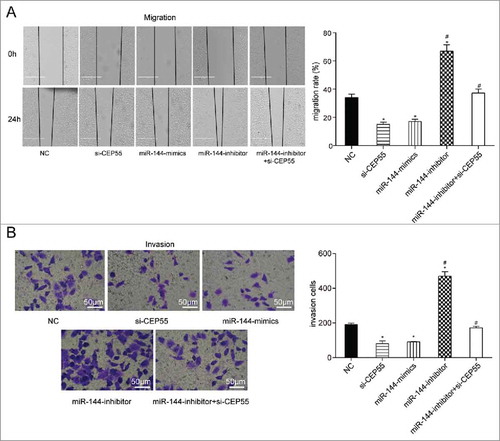
MiR-144 could restrain migration and invasion by down-regulating CEP55. (A-B) The migration and invasion abilities were detected by wound healing assay (scale bar: 50 μm) and transwell assay (scale bar: 50 μm). MiR-144 mimics and si-CEP55 significantly inhibited the migration and invasion while miR-144 inhibitor significantly promoted the migration and invasion of breast cancer cells. *P < 0.05, compared with NC group and miR-144 inhibitor + si-CEP55 group. # P < 0.05, compared with si-CEP55 group and miR-144 mimics group.
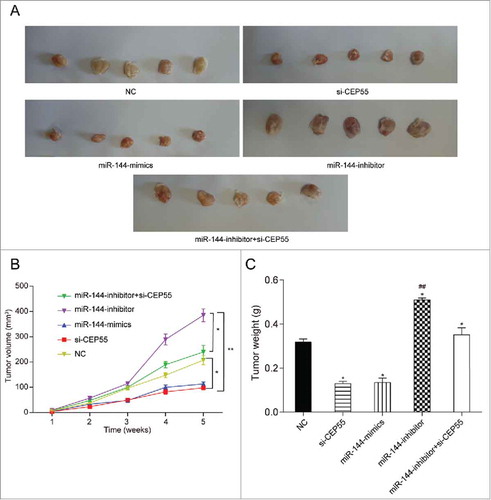
MiR-144 could inhibit cell progression through down-regulating CEP55 in vivo. (A) The tumor samples of miR-144 inhibitor group were the biggest while si-CEP55 and miR-144 mimics groups were the smallest. (B) The measurement of tumor volume showed that miR-144 inhibitor group had the biggest tumor and si-CEP55 and miR-144 mimics groups had the smallest tumor, *P < 0.05, compared with NC group and miR-144 inhibitor + si-CEP55 group, **P < 0.01, compared with miR-144 inhibitor group. (C) The measurement of tumor weight suggested that miR-144 inhibitor induced tumor growth and si-CEP55 and miR-144 mimics showed reverse function. *P < 0.05, compared with NC group, ## P < 0.01, compared with si-CEP55 group and miR-144 mimics group.