Figures & data
Figure 1. Expression of FAK and effect of FAK inhibitors on the growth of MPM and PDAC cell lines. (A) Panel of MPM and PDAC cell lines analyzed for FAK using immunoblot analysis and β-Actin was used as loading control. (B) Gene expression microarray data from the National Center for Biotechnology Information Gene express Omnibus (GEO) (www.ncbi.nlm.nih.gov/geoprofiles) for FAK from mesothelioma (Reporter: GPL96, 207821_s_at (ID_REF), GDS1220, 5747 (Gene ID), NM_005607) and pancreatic cancer samples (Reporter: GPL570, 1559529_at (ID_REF), GDS4102, 5747 (Gene ID), BC043202). Number of samples for normal pleura, n = 5, normal lung, n = 4, and for malignant pleural mesothelioma, n = 42 (left). For pancreatic cancer, the number of samples for normal pancreas, n = 16, and for pancreatic cancer n = 36. (C) Viability curves of MPM cell lines and (D) PDAC cell lines after treatment with the FAK inhibitors PF-431396, PF-573228 and VS-6063 for 72 h and cell viability was then assessed using Almar blue assay. The results were normalized as a percentage of untreated controls and analyzed using graphpad Prism software (version 7.02) to calculate the EC50 value for each drug. All experiments were repeated at least twice and each concentration was assayed in triplicate for each experiment.
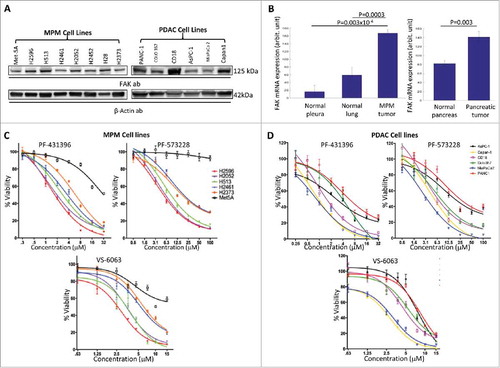
Figure 2. FAK inhibitors, PF-431396, PF-573228 and VS-6063, induces apoptosis in both MPM and PDAC cells. (A, B) H2596 and (C, D) MiaPaca 2 cells were stained with Annexin V-FITC/PI after treatment with the inhibitors and were analyzed by flow cytometry. Results are expressed as the mean percentage of apoptotic cells ± SEM. (*p<0.05, **p<0.01, ***p<0.001).
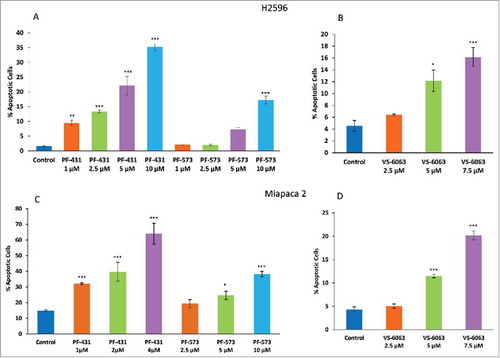
Figure 3. Treatment of MPM and PDAC cells with FAK inhibitors result in G2/M arrest. Summary of percentage of cells in each cell cycle phase after the treatment of both H2596 (A, B) and Miapaca 2 (C, D) cells with PF-431396, PF-573228, and VS-6063 for 48 h. Data is shown as the % of cells in G1, S, and G2-M phases ± SEM. (*p<0.05, **p<0.01, ***p<0.001).
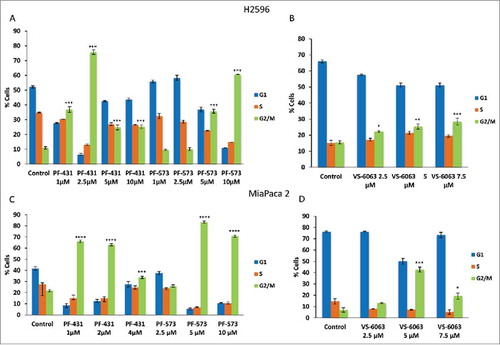
Figure 4. FAK inhibition modulates PARP and Cyclin D1 proteins in MPM and PDAC cells. (A) MPM and (B) PDAC cells. Cells were treated with PF-573228 (5 and 10 µM) or PF-431396 (4 and 8 µM) FAK inhibitors for 48h, subjected to Western blot analysis, and analyzed for cleaved PARP and cyclin D1 protein levels.
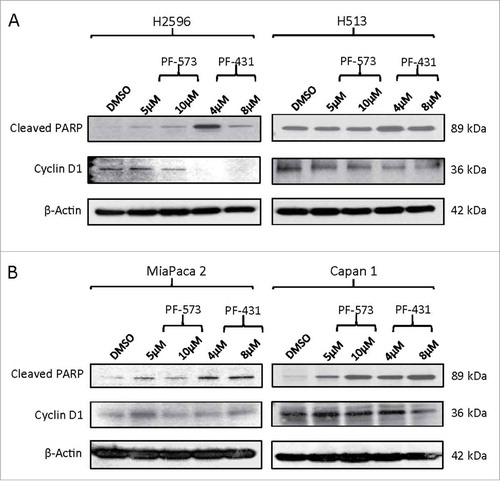
Figure 5. Effect of FAK inhibitors on downstream signaling pathway in MPM and PDAC cells. (A) Immunoblots of MPM and (B) PDAC cells after treatment with indicated concentrations of VS-6063 for 24 h. (C) Immunoblots of PDAC cells treated with indicated concentrations of PF-431396 and PF-573228 for 24h. The cells were stimulated with human recombinant HGF (100 ng/ml) before preparing the cell lysates.
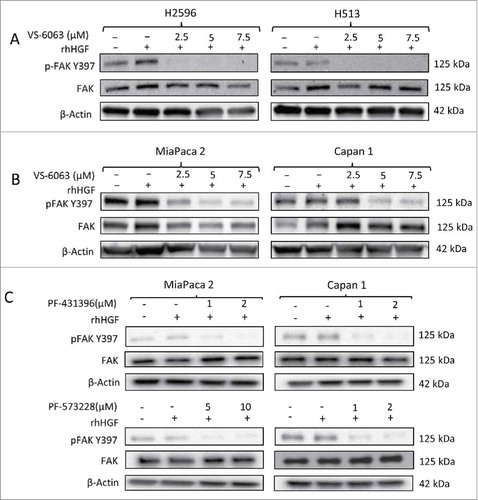
Figure 6. PF-431396, PF-573228, and VS-6063 inhibit the anchorage independent growth of MPM and PDAC cells in a soft agar assay. Colony formation assay showing cell growth inhibition of H2596 (A-D) and MiaPaca 2 (E-H) cells in response to treatment with FAK inhibitors. A, E show decrease in the number of colonies whereas C and G showed decrease in the size of colonies after the treatment of both the cell lines with the FAK inhibitors. Representative colony images are shown in B, D, F and H. Results are expressed as number of colonies per field of view ± SEM. (*p<0.05, **p<0.01, ***p<0.001). Scale bar = 20 μm.
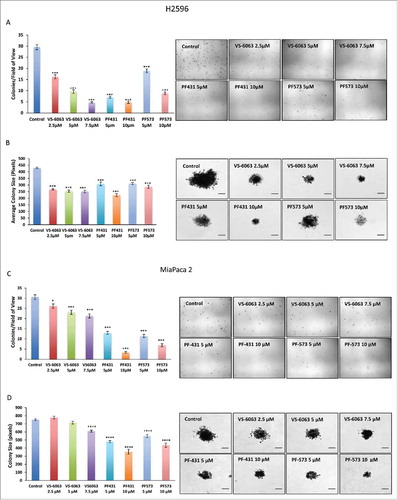
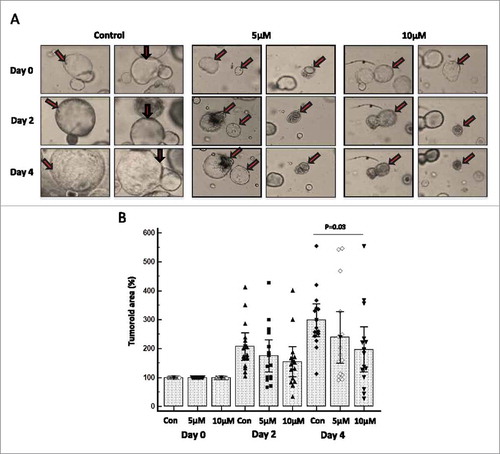
Figure 7. FAK-specific inhibitor PF-573228 restricts the growth of murine pancreatic tumor organoids. We have generated and cultured tumor organoids derived from the well-established KrasG12D; Pdx-1 Cre (KC) mouse model of pancreatic cancer. Murine KC organoids grow with pancreatic ductal adenocarcinoma architectures when supplemented with specialized media. Tumoroids were treated with 5 and 10 μM concentrations of PF-573228 for 24 h and the effect of FAK inhibitor was followed for 0 to 4 days and images were taken using EVOS FL Auto Cell Imaging System once in every 48 h at 20X magnification. (A) Representative light microscopic images (Magnification at 20X) of KC organoids treated with no drug, 5 and 10 μM concentration of PF-573228 at days 0, 2 and 4. Arrows are pointing out the morphological resemblance of organoids at day 0, 2 and 4. (B) The effect of FAK inhibitor on tumoroids was determined by measuring the tumoroid area of each organoid in the micro square using the quantification software installed in the imaging system. Box and whisker plot shows the effect of FAK inhibitor PF-573228 at two different doses 5 and 10 μM on KC tumoroids. The growth of KC organoids was reduced at both lower (5 μM) and higher concentration (10 μM) on both days of 2 and 4. Statistical significance (P = 0.03) exists between control or no drug treatment and 10 μM concentration of PF-573228 treatment on KC organoids at day four (after drug exposure).