Figures & data
Table 1. Main patient and tumor characteristics (N: 196 pts).
Table 2. Main patient and tumor characteristics by categories of body mass index (N: 196 pts).
Table 3. Response and disease control rate in the overall study population and subgroups defined upon molecular subtype across BMI strata (N:196).
Table 4. Multivariate analysis of factors impacting treatment outcomes in the overall study population (N:196).
Figure 1. Progression-Free Survival (A) and Overall Survival (B) by molecular subtype in the overall study population (N:196).
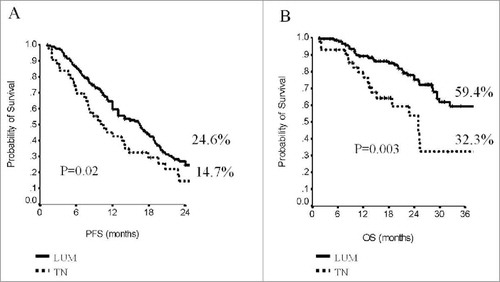
Figure 2. Progression-Free Survival (A) and Overall Survival (B) in triple negative cancer cases (N:43) across strata of body mass index (BMI).
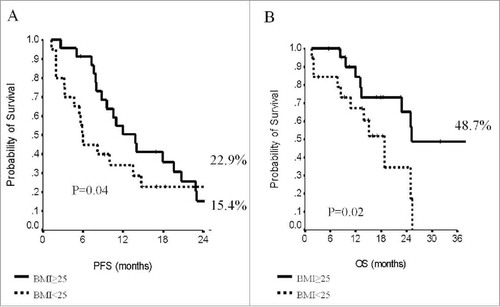
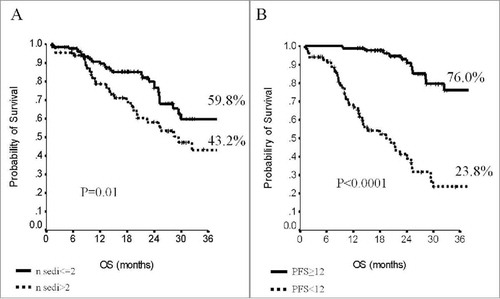
Figure 3. Overall Survival by number of metastatic sites (A) and length of progression free survival in the overall study population (N: 196).