Figures & data
Figure 1. UBE2C up-regulated in rectal carcinoma. A) Western bolt showed protein levels of UBE2C in 5 rectal carcinomas compare to their para-carcinoma tissues. B) Q-PCR showed the expression level of UBE2C in another 13 rectal carcinoma tissue samples. ## indicated p<0.01.
Figure 2. siRNA of UBE2C down-regulated the expression level of UBE2C in HR-8348 cells. A) Western blot showed the protein level of UBE2C after the treatment of siRNA. B) Q-PCR showed the expression level of UBE2C in the cells with different treatments as indicated. ### indicated p<0.001.
Figure 3. UBE2C promoted the cell proliferation in HR-8348 cells. A) Cell counting assay showed the cell proliferation with the different treatments as indicated. B) The viability of HR-8348 cells with different treatments were determined by cck-8 kit. ### indicated p<0.001. C) and D) Colonies assay showed the less colonies numbers after the RNAi of UBE2C.
Figure 4. UBE2C inhibited apoptosis and promoted the tumor invasion. A) The apoptosis of the HR-8348 cells with different treatment as indicated was determined by using the Annexin-V-FITC & PI Apoptosis Kit and assessed by flow cytometry. n = 3 independent experiments and this panel presented one of these repeats. B) Statistic of percentage of the apoptosis cells performed in panel (A). Data showed the Annexin-V and PI double positive cells. Data were represented as mean ± s.d.; n = 3 independent experiments. ###indicated p < 0.001 while ## indicated p < 0.01. C) Tumor invasion was determined by transwell. D) Statistic of transferred cells performed in panel (C). ## indicated p < 0.01.
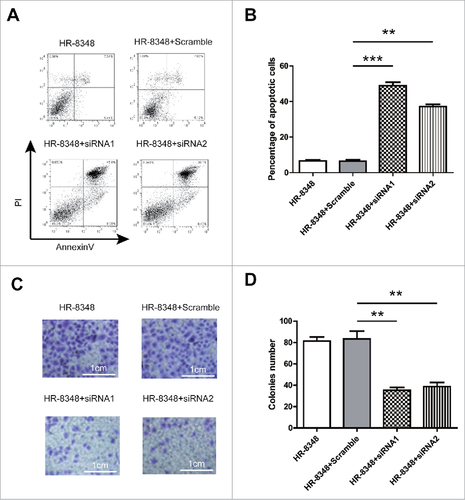
Figure 5. UBE2C promoted rectal carcinoma in vivo. A) Tumor generated by HR-8348 with different treatment as indicated was measured in diameters and calculated to volume according to the time point. B) Survival curve of the mice injected with different cells. Each group contains 20 mice.
Figure 6. miR-381 regulated the expression level of UBE2C. A) Schema showed the complimentary domain between miR-381 and UBE2C. B) Western blot showed the protein level of UBE2C after the treatment of miRNA. C) The viability of HR-8348 cells with different treatments were determined by cck-8 kit. ## indicated p < 0.01.
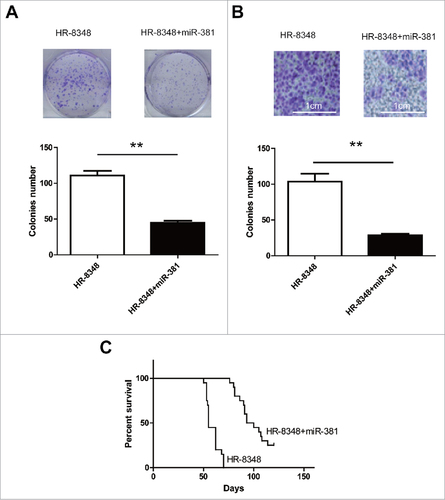
Figure 7. miR-381 directly inhibited the growth of rectal carcinoma both in vitro and in vivo. A) Colonies assay showed the colonies numbers after the transfection of miR-381. ## indicated p < 0.01. B) Tumor invasion was determined by transwell. ## indicated p<0.01. C) Survival curve of the mice injected with different cells. Each group contains 20 mice.