2,676
Views
0
CrossRef citations to date
0
Altmetric
Research Paper

PD1 protein expression in tumor infiltrated lymphocytes rather than PDL1 in tumor cells predicts survival in triple-negative breast cancer

, , , , , , & show all
Pages 373-380 | Received 16 Oct 2017, Accepted 29 Dec 2017, Published online: 16 Feb 2018

Figures & data

Table 1. Patient characteristics.

Table 2. Tumor cells PDL1 protein and mRNA expression relationship with clinicopathological features.

Table 3. TILs PD1 protein and mRNA expression and their relationship with clinicopathological features.

Figure 1. (A) K-M survival analysis showed that TILs PD1 protein expression was significantly influence DFS time. (B) K-M survival analysis showed that TILs PD1 protein expression was significantly prolongated OS time.
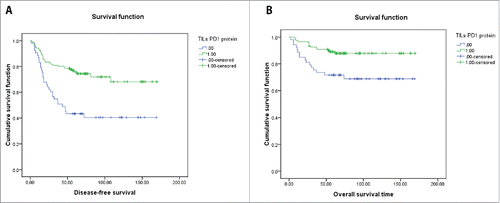
Figure 1. (A) K-M survival analysis showed that TILs PD1 protein expression was significantly influence DFS time. (B) K-M survival analysis showed that TILs PD1 protein expression was significantly prolongated OS time.

Figure 2. PDL1 protein and mRNA staining in triple negative breast cancer. (A) IHC shows PDL1 protein expression in the tumor cells (200x). (B) RNAscope shows PDL1 mRNA expression in the same case as in A (400x). (C) IHC shows negative PDL1 protein staining in the tumor cells (200x). (D) RNAscope shows positive PDL1 mRNA expression in the same case as in C (400x).
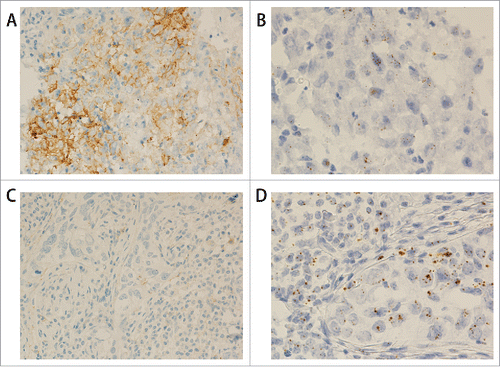
Figure 2. PDL1 protein and mRNA staining in triple negative breast cancer. (A) IHC shows PDL1 protein expression in the tumor cells (200x). (B) RNAscope shows PDL1 mRNA expression in the same case as in A (400x). (C) IHC shows negative PDL1 protein staining in the tumor cells (200x). (D) RNAscope shows positive PDL1 mRNA expression in the same case as in C (400x).

Table 4. PD1/PDL1 mRNA and their corresponding protein comparison.

Figure 3. PD1 protein and mRNA staining in triple negative breast cancer. (A) RNAscope shows PD1 mRNA expression in TILs (400x). (B) IHC shows PD1 protein expression in the same case as in A (200x). (C) RNAscope shows negative PD1 mRNA expression in TILs (400x). (D) IHC shows PD1 protein expression in the same case as in C (200x).
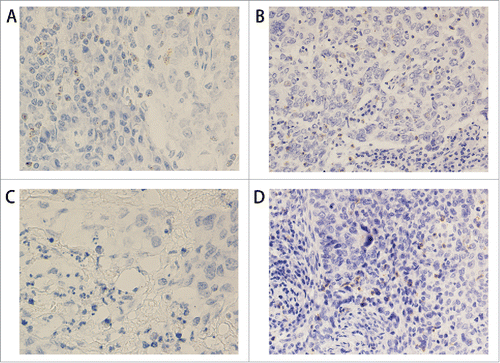
Figure 3. PD1 protein and mRNA staining in triple negative breast cancer. (A) RNAscope shows PD1 mRNA expression in TILs (400x). (B) IHC shows PD1 protein expression in the same case as in A (200x). (C) RNAscope shows negative PD1 mRNA expression in TILs (400x). (D) IHC shows PD1 protein expression in the same case as in C (200x).

Table 5. Antibodies used for the immunohistochemical analysis.

Reprints and Corporate Permissions

Please note: Selecting permissions does not provide access to the full text of the article, please see our help page How do I view content?

To request a reprint or corporate permissions for this article, please click on the relevant link below:

Academic Permissions

Please note: Selecting permissions does not provide access to the full text of the article, please see our help page How do I view content?

Obtain permissions instantly via Rightslink by clicking on the button below:

If you are unable to obtain permissions via Rightslink, please complete and submit this Permissions form. For more information, please visit our Permissions help page.