Figures & data
Figure 1. SIX1 was high expressed and DACH1 was low expressed in HCC tissues and cells. (A) Heat map showed that SIX1 was high expressed and DACH1 was low expressed in HCC tissues compared with adjacent tissues. (B) Volcano plot of SIX1 overexpression and DACH1 suppression showed statistical significance (P < 0.05). (C-D) RT-qPCR analysis showed high expression of SIX1 mRNA and low expression of DACH1 mRNA in 50 samples (P < 0.001). (E) WB results showed the high expression of SIX1 and the low expression of DACH1 in HCC tissues of five patients. (F) SIX1 was high expressed and DACH1 was low expressed in three kinds of HCC cell lines (SK-HEP-1, Huh-7 and HepG2) compared with normal human hepatoma cell line (HL-7702 [L-02]).
![Figure 1. SIX1 was high expressed and DACH1 was low expressed in HCC tissues and cells. (A) Heat map showed that SIX1 was high expressed and DACH1 was low expressed in HCC tissues compared with adjacent tissues. (B) Volcano plot of SIX1 overexpression and DACH1 suppression showed statistical significance (P < 0.05). (C-D) RT-qPCR analysis showed high expression of SIX1 mRNA and low expression of DACH1 mRNA in 50 samples (P < 0.001). (E) WB results showed the high expression of SIX1 and the low expression of DACH1 in HCC tissues of five patients. (F) SIX1 was high expressed and DACH1 was low expressed in three kinds of HCC cell lines (SK-HEP-1, Huh-7 and HepG2) compared with normal human hepatoma cell line (HL-7702 [L-02]).](/cms/asset/f6a8fb95-828c-428a-8779-0acaaf38f71e/kcbt_a_1423920_f0001_oc.gif)
Figure 2. SiRNAs could significantly inhibit SIX1 and DACH1 expressions. (A-B) WB results showed that si-SIX1-2 had the best inhibition efficiency of SIX1 expression and si-DACH1-1 had the best inhibition efficiency. (C&E) QPCR and WB verified high expression of SIX1 in cDNA-SIX1 group and low expression of SIX1 in si-SIX1−2 group and si-SIX1-3 group. (D&F) QPCR and WB verified high expression of DACH1 in cDNA-DACH1 group and low expression of DACH1 in si-DACH1−1 and si-DACH1-3 group.
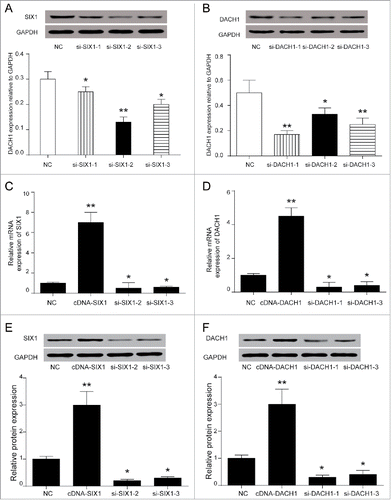
Figure 3. SIX1 promoted proliferation and inhibited apoptosis while DACH1 had an opposite effect. (A-B) SIX1 promoted proliferation while DACH1 inhibited proliferation. The overexpression of SIX1 and suppression of DACH1 promoted cell proliferation by colony formation assay. On the contrary, the suppression of SIX1 and overexpression of DACH1 inhibited cell proliferation. *P < 0.05 indicated significant difference compared with NC group. (C-D) SIX1 inhibited cell apoptosis and DACH1 promoted cell apoptosis. The overexpression of SIX1 and the inhibition of DACH1 suppressed cell apoptosis. Oppositely, the inhibition of SIX1 and overexpression of DACH1 promoted cell apoptosis.
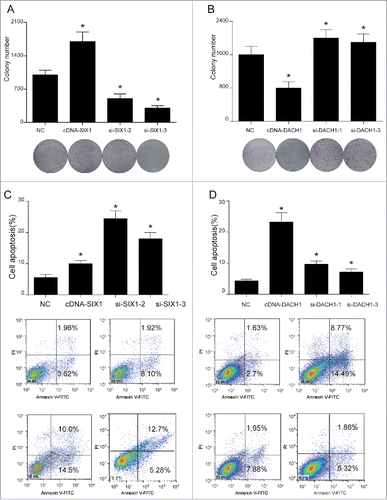
Figure 4. SIX1 promoted cell cycle while DACH1 retarded cell cycle. (A-B) SIX1 suppression and DACH1 overexpression retarded cell cycle at G2/M phase. However, SIX1 overexpression and DACH1 suppression greatly reduced cells that retarded at G2/M phase. (C-D) p21 expression was elevated and CDK1 expression was inhibited when cell cycle was retarded. p21 expression was suppressed and CDK1 expression was improved when SIX1 was overexpressed and DACH1 was suppressed. Reversely, p21 expression was elevated and CDK1 expression was suppressed when SIX1 was inhibited and DACH1 was overexpressed. *P < 0.05 indicated significant difference compared with NC group.
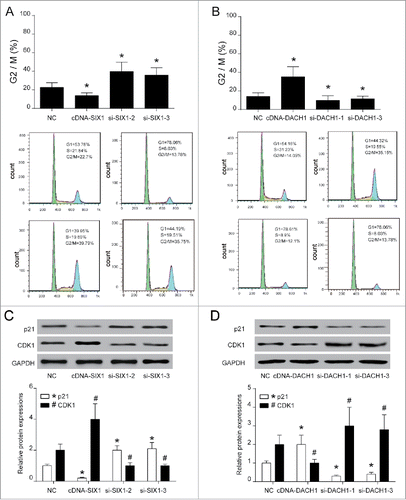
Figure 5. SIX1/DACH1 regulated p53 expression. (A-B) Immunofluorescence co-localization observed that the relative position of p53 protein and SIX1 protein overlap significantly, indicating possible combination. (C) SIX1 co-precipitated with DACH1 and DACH1 co-precipitated with SIX1 and p53. In overexpression group, DACH1, p53 and SIX1 were detected. In Flag IP group, DACH1 directly interacted with SIX1 and p53. In His IP group, SIX1 directly interacted with p53 only. (D-E) SIX1 suppressed DACH1 and p53 expression but DACH1 could only influence p53 expression. SIX1 overexpression inhibited DACH1 and p53 protein expression and promoted MDM2 expression. SIX1 suppression promoted DACH1 and p53 protein expression and inhibited MDM2 expression. DACH1 overexpression promoted p53 expression and inhibited MDM2 expression. DACH1 suppression inhibited p53 expression and promoted MDM2 expression. *P < 0.05 indicated significant difference compared with NC group. *, #, &, $ P < 0.05 indicated statistical significance compared with NC group.
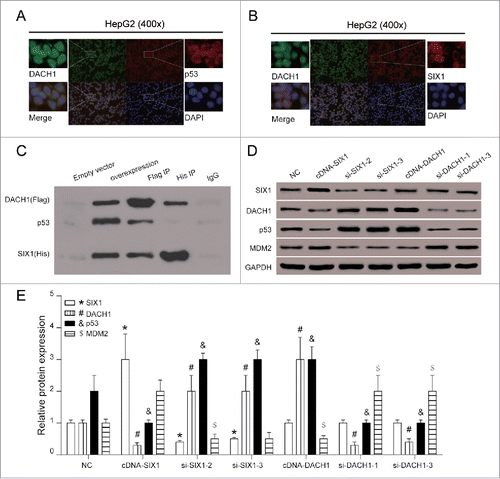
Figure 6. Effects of SIX1/DACH1 on tumor growth in vivo. (A&B&D) SIX1 promoted tumor growth and DACH1 inhibited tumor growth. Tumor size in cDNA-SIX1 group was the largest, and in cDNA-DACH1 group was the smallest. (C) Tumor in cDNA-SIX1 group was the heaviest, and in cDNA-DACH1 group was the lightest on day 28. (E) SIX1 was highly expressed, DACH1 was lowly expressed and p53 was lowly expressed in large tumors. On the contrary, SIX1 was lowly expressed, DACH1 was highly expressed and p53 was highly expressed in small tumors. *P < 0.05 indicated significant difference compared with Blank and NC group.
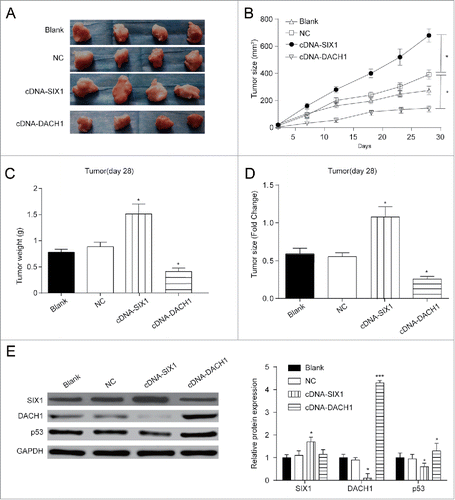
Table 1. siRNA design.
Table 2. SIX1 and DACH1 expressions in hepatocarcinoma.
Table 3. Oligonucleotide primer sequences.
