1,503
Views
2
CrossRef citations to date
0
Altmetric
Research Paper

MiR-422a weakened breast cancer stem cells properties by targeting PLP2

, , , , , , , , , , , , & show all
Pages 436-444 | Received 20 Sep 2017, Accepted 23 Jan 2018, Published online: 30 Mar 2018

Figures & data

Table 1. Primers for qRT-PCR.

Figure 1. MiR-422a was lowly expressed while PLP2 was highly expressed in BCSCs. (A) Microarray analysis indicated that miR-422a was lower expressed in BCSCs than in breast cancer cell line MCF-7. (B) Microarray analysis indicated that PLP2 was higher expressed in BCSCs than in breast cancer cells. (C) qRT-PCR of miR-422a expression verified that miR-422a was lower expressed in BCSCs than in breast cancer cells. (D-E) qPCR and western blot analysis verified that PLP2 was higher expressed in BCSCs than in breast cancer cells. **P < 0.01, ***P < 0.001 indicated significant difference compared with normal epithelial cells. ##P < 0.01, ###P < 0.001 indicated significant difference compared with breast cancer cells.
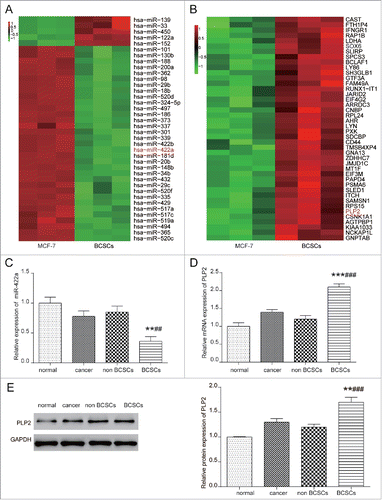
Figure 1. MiR-422a was lowly expressed while PLP2 was highly expressed in BCSCs. (A) Microarray analysis indicated that miR-422a was lower expressed in BCSCs than in breast cancer cell line MCF-7. (B) Microarray analysis indicated that PLP2 was higher expressed in BCSCs than in breast cancer cells. (C) qRT-PCR of miR-422a expression verified that miR-422a was lower expressed in BCSCs than in breast cancer cells. (D-E) qPCR and western blot analysis verified that PLP2 was higher expressed in BCSCs than in breast cancer cells. **P < 0.01, ***P < 0.001 indicated significant difference compared with normal epithelial cells. ##P < 0.01, ###P < 0.001 indicated significant difference compared with breast cancer cells.

Figure 2. MiR-422a downregulated PLP2 expression in BCSCs. (A) MiRanda predicted site 285 as binding sites. (B) Dual-Luciferase reporter assay verified that miR-422a directly targeted at PLP2 wild type and downregulated luciferase activity (P < 0.05). (C-F) MiR-422a expression was increased in miR-422a mimics group and miR-422a mimics+PLP2 group. PLP2 expression was decreased in miR-422a mimics group and increased in PLP2 group, but was not influenced significantly in miR-422a mimics+PLP2 group. **P< 0.01 indicated significant difference compared with NC group.
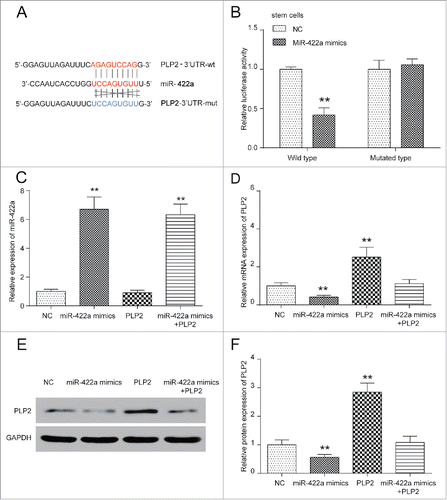
Figure 2. MiR-422a downregulated PLP2 expression in BCSCs. (A) MiRanda predicted site 285 as binding sites. (B) Dual-Luciferase reporter assay verified that miR-422a directly targeted at PLP2 wild type and downregulated luciferase activity (P < 0.05). (C-F) MiR-422a expression was increased in miR-422a mimics group and miR-422a mimics+PLP2 group. PLP2 expression was decreased in miR-422a mimics group and increased in PLP2 group, but was not influenced significantly in miR-422a mimics+PLP2 group. **P< 0.01 indicated significant difference compared with NC group.

Figure 3. MiR-422a suppressed BCSCs properties by PLP2 downregulation. (A) BCSCs population decreased in miR-422a mimics group and increased in PLP2 overexpression group. (B) Stemness markers OCT4 and SOX2 expression were significantly suppressed in miR-422a mimics group and elevated in PLP2 overexpression group.
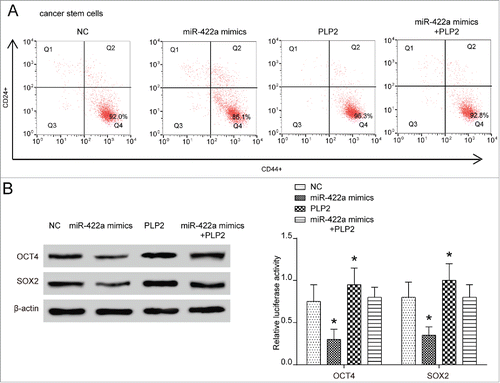
Figure 3. MiR-422a suppressed BCSCs properties by PLP2 downregulation. (A) BCSCs population decreased in miR-422a mimics group and increased in PLP2 overexpression group. (B) Stemness markers OCT4 and SOX2 expression were significantly suppressed in miR-422a mimics group and elevated in PLP2 overexpression group.

Figure 4. MiR-422a inhibited while PLP2 promoted BCSCs proliferation. (A) Bright field images of sphere formation assays displayed that miR-422a mimics led to a decrease while PLP2 overexpression led to an increase in tumorsphere formation. (B) MiR-422a inhibited cell proliferation and PLP2 accelerated the proliferation while joint expression of miR-422a and PLP2 revealed no significant changes in cell formation assay. (C) Cell proliferation was significantly repressed in miR-422a mimics group while upregulated in PLP2 group in CCK8 assay. Similar proliferation rate was detected in the mix group compared with NC group. **P < 0.01 indicated significant difference compared with NC group. Scale bar: 50 μm.
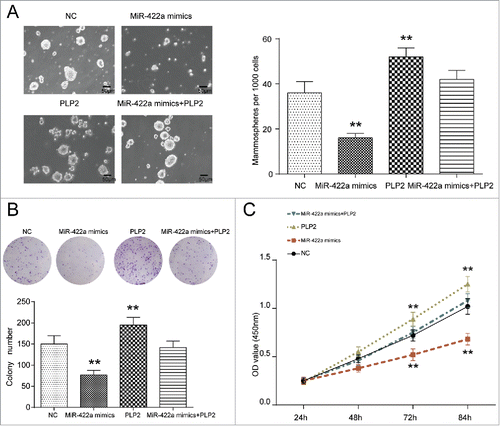
Figure 4. MiR-422a inhibited while PLP2 promoted BCSCs proliferation. (A) Bright field images of sphere formation assays displayed that miR-422a mimics led to a decrease while PLP2 overexpression led to an increase in tumorsphere formation. (B) MiR-422a inhibited cell proliferation and PLP2 accelerated the proliferation while joint expression of miR-422a and PLP2 revealed no significant changes in cell formation assay. (C) Cell proliferation was significantly repressed in miR-422a mimics group while upregulated in PLP2 group in CCK8 assay. Similar proliferation rate was detected in the mix group compared with NC group. **P < 0.01 indicated significant difference compared with NC group. Scale bar: 50 μm.

Figure 5. MiR-422a mimics and PLP2 shRNA attenuated BCSCs tumorigenesis in vivo. (A) MiR-422a expression was increased in miR-422a overexpressing group and PLP2 expression was decreased in lv-miR-422a group and lv-shPLP2 group. (B) Mice in lv-NC group inoculated with 2 × 10⁶ /ml cells into fat pad formed 1.5 µm tumors in 35 ‘d’, while those in lv-miR-422a group and lv-shPLP2 group failed to form palpable tumors. Mice in lv-NC group inoculated with 5 × 10⁶ /ml cells into fat pad formed 1.5 µm tumors in 28 ‘d’ but lv-shPLP2 group as well as lv-shPLP2 group displayed no significant changes. **P < 0.01 indicated significant difference compared with NC group.
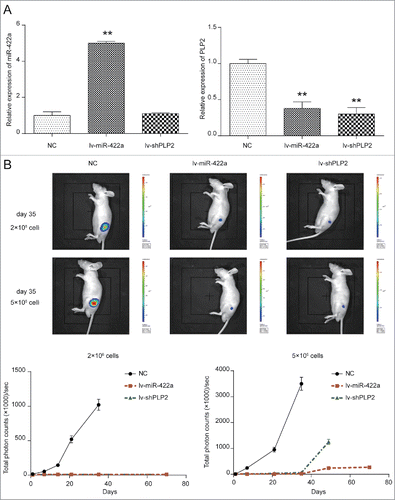
Figure 5. MiR-422a mimics and PLP2 shRNA attenuated BCSCs tumorigenesis in vivo. (A) MiR-422a expression was increased in miR-422a overexpressing group and PLP2 expression was decreased in lv-miR-422a group and lv-shPLP2 group. (B) Mice in lv-NC group inoculated with 2 × 10⁶ /ml cells into fat pad formed 1.5 µm tumors in 35 ‘d’, while those in lv-miR-422a group and lv-shPLP2 group failed to form palpable tumors. Mice in lv-NC group inoculated with 5 × 10⁶ /ml cells into fat pad formed 1.5 µm tumors in 28 ‘d’ but lv-shPLP2 group as well as lv-shPLP2 group displayed no significant changes. **P < 0.01 indicated significant difference compared with NC group.

Reprints and Corporate Permissions

Please note: Selecting permissions does not provide access to the full text of the article, please see our help page How do I view content?

To request a reprint or corporate permissions for this article, please click on the relevant link below:

Academic Permissions

Please note: Selecting permissions does not provide access to the full text of the article, please see our help page How do I view content?

Obtain permissions instantly via Rightslink by clicking on the button below:

If you are unable to obtain permissions via Rightslink, please complete and submit this Permissions form. For more information, please visit our Permissions help page.