
Figures & data
Figure 1. HOXA10 was overexpressed in HNSCC. (A) HOXA10 expression in 43 tumor samples relative to the corresponding normal tissues. (B) The expression quantity of HOXA10 in the tumor tissues was about 6.87 times higher than that in the paired normal tissues. (C) The expression of HOXA10 protein in tumor tissues was significantly higher than that in tissues adjacent to cancer (****P<0.0001, n = 43, compared with tumor adjacent group). (D) The expression level of mRNA of HOXA10 in the tumor tissues was higher than that in tissues adjacent to cancer (****P<0.0001, n = 43, compared with tumor adjacent group). (E-F) According to the analysis to 291 HNSCC cases in TCGA data base, the overall survival of low HOXA10 expression patients (P = 0.01023, compared with low HOXA10 expression group) and disease-free survival (P = 0.00836, compared with low HOXA10 expression group) of low HOXA10expression was better than that of high HOXA10 expression.
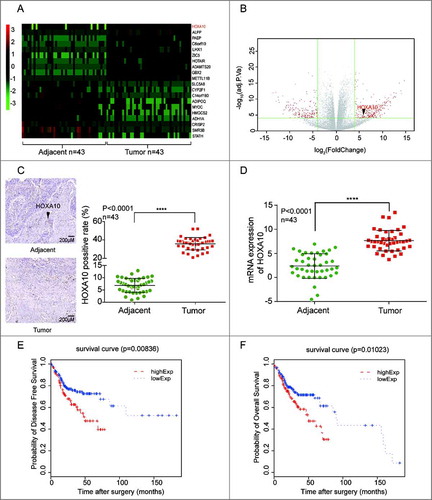
Figure 2. miR-135a-5p was under-expressed in HNSCC. (A) miR-135a-5p, which could target at HOXA10, was low expressed. (B) 23 miRNAs in tumor tissues were apparently low expressed. (C) miR-135a-5p was low expressed in tumor tissues than normal tissues (****P<0.0001, n = 43, compared with tumor adjacent group). (D) The expression of miR-135a-5p and HOXA10 was negatively correlated in HNSCC tissues (P<0.0001, R = 0.6728, n = 43).
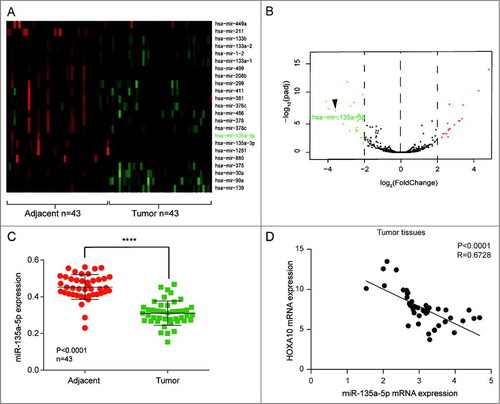
Figure 3. MiR-135a-5p directly targeted at HOXA10 3’UTR. (A) TartgetScan and miRanda analysis: miR-135a-5p directly target at HOXA10, and the target site was the 220 nt of 3’UTR on HOXA10. The schematic diagram of the experimental vector was provided for the fluorescence reporting assay. (B) The effect of miR135a-5p to repress HOXA10 expression was better than that of miR-494, which is found to target HOXA10 in oral cancer (**P<0.01,*P<0.05, compared with the 3’UTR of HOXA10 (WT) group, #P<0.05, compared with the 3’UTR of HOXA10 (MUT) group). (C) HOXA10 expression quantity in tumor cell lines (NEC, CAL-27 and FaDu) was higher than that in normal cell line (Het-1A), whereas the HOXA10 expression quantity in the three tumor cell lines was similar (**P<0.01,*P<0.05, compared with the Het-1A cell). (D) High levels of miR-135a-5p always corresponded with low HOXA10 expression. Particularly, among all the transfection concentrations, 150 nM miR-135a-5p-mimics let to the most significant level of inhibitory effect on HOXA10 expression (**P<0.01,*P<0.05, compared with the 0nM group). (E-F) MiR-135a-5p could inhibit HOXA10 expression more effectively than miR-494 (**P<0.01,*P<0.05, compared with the control).
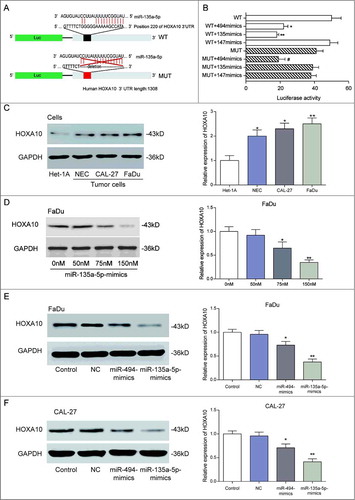
Figure 4. Effects of HOXA10 on the proliferation and apoptosis of cells. (A-B) We screened stable high expression HOXA10 and non-expression HOXA10 transfected cell strains by transfection plasmid overexpression system and CRISP/CAS9 gene knockout system (***P<0.001, **P<0.01, compared with control group). (C) The quantity of tumor cells of HOXA10-KO group was lower than that of control group by colony formation assay (student t-test, ***P<0.001, compared with control group), whereas the number of tumor cells of pcDNA3.1-HOXA10 group was higher than that of control group (***P<0.001, compared with control group), which manifested that HOXA10 could facilitate the proliferation of tumor cells. (D) The number of apoptotic cells in HOXA10-KO was highly increased while that of the overexpression group was decreased by cell apoptosis assay. The fact illustrated the inhibitory action of HOXA10 to the apoptosis of tumor cells (****P<0.0001, **P<0.01, compared with control group).
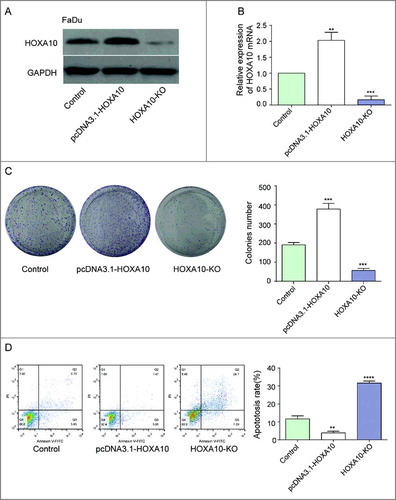
Figure 5. Inhibitory effects of miR-135a-5p on tumor cells by targeting HOXA10 in vitro. (A) Colony forming assay showed the capability of miR-135a-5p and miR-494 to repress the growth of tumor cells, and that the former one was better than the latter. Meanwhile, the number of cells in HOXA10-KO is lower (****P<0.0001, ***P<0.001, compared with pcDNA3.1-HOXA10 group). (B) Flow cytometry result implied that both miRNAs had inhibitory effect on the apoptosis of tumor cells, and miR-135a-5p was better (****P<0.0001, ***P<0.001, compared with pcDNA3.1-HOXA10 group).
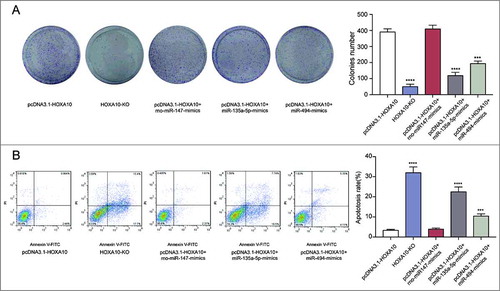
Figure 6. Inhibitory effects of miR-135a-5p on tumor cells by targeting HOXA10 in vivo. (A-B) The tumor volume of HOXA10 overexpression group was the largest, that of HOXA10-KO group was the smallest. Tumor growth of pcDNA3.1-HOXA10+miR-135a-5p group was impaired relatively (**P<0.01, *P<0.05, compared with pcDNA3.1-HOXA10 group). (C) Larger tumors always corresponded with higher level of HOXA10 expression. The HOXA10 expression in pcDNA3.1-HOXA10+miR-135a-5p group was lower compared with pcDNA3.1-HOXA10 group which was evaluated by WB. MiR-135a-5p could restrain the growth of tumor and the expression of HOXA10 (**P<0.01, *P<0.05, compared with pcDNA3.1-HOXA10 group).
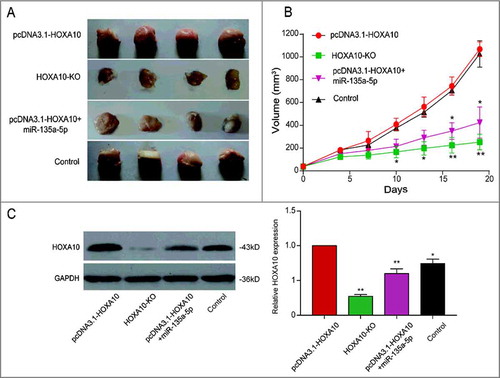
Table 1. The clinical characteristics of the study population.
Table 2. The primers for conduction of qRT-PCR.