
Figures & data
Figure 1. MBD2 was Overexpressed in CML-BP Patients, and MBD2 Expression was Deleted by CRISPR/Cas9-mediated Gene Disruption in K562 Cells. (A) Normal BM samples were collected from healthy volunteer donors as healthy controls. The mRNA levels of MBD2 were detected in CML-CP, CML-BP patients and healthy controls via qRT-PCR. (B, C) The cell model of homozygous deletion mutation of MBD2 was constructed by using the CRISPR/Cas9 gene editing system in K562 cells. QRT-PCR (B) and Western blotting (C) were used to measure the different expression levels of MBD2 in K562 (MBD2 WT vs. MBD2 KO) cells. (D) The representative pictures of immunofluorescence in MBD2 WT and MBD2 KO cells, which demonstrate the expression level of MBD2. Blue, DAPI; Red, MBD2; magnification of x400. *P < 0.05 by Student's t-test.
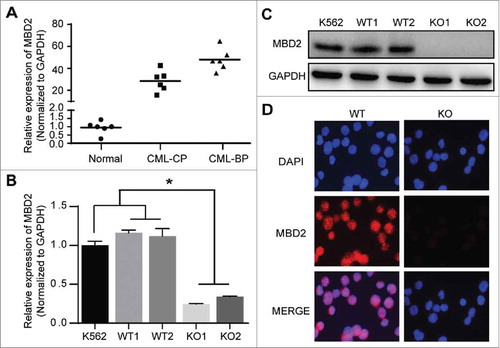
Figure 2. MBD2 Deletion Inhibited the Proliferation of K562 Cells in Vitro. (A) A cell-cycle analysis of the WT and KO group cells was performed by flow cytometry and PI staining. (B) The relative distribution of the cell cycle of K562 (MBD2 WT vs. MBD2 KO) cells showed evident arrest of the cell cycle. (C) Apoptosis was monitored on K562 (MBD2 WT vs. MBD2 KO) cells using flow cytometry and Annexin V/PI staining. The graph shows quantifications of apoptotic cells as a per cent of Annexin V and PI-positive cells. (D) K562 (MBD2 WT vs. MBD2 KO) cells were placed in methylcellulose media. The graph represents the calculation of colonies formed after culturing for 10 d. (E) Representative images of colony formation in WT (left) and KO (right) groups. (F) The WT and KO group cells were stained with CFSE and cultured for an additional 72h. The number of cells in each generation was estimated by deconvolution of the FACS data, and the proliferation index (PI) was calculated using ModiFit software. Representative modeled generational subsets (colored curves; Gen 2 to 8, generation 2 to 8) are shown. Each experiment was repeated three times. *, P < 0.05 by Student's t-test.
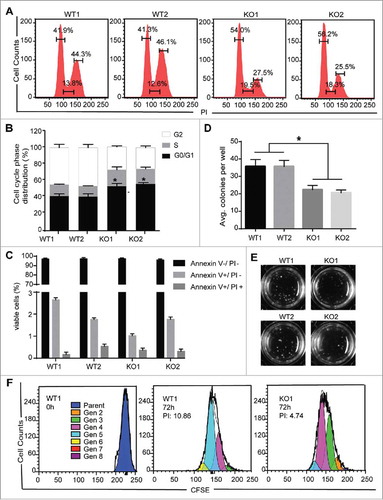
Figure 3. Inactivation of MBD2 Affected the Cell Cycle of K562 and BV173 Cells. The inactivation of MBD2 was constructed by transfecting lentivirus with Cas9 system in K562 and BV173 cells. QRT-PCR (A) and Western blotting (B) were used to measure the expression levels of MBD2 in shMBD2 and shSCR groups of K562 and BV173 cells, respectively. (C)Cell-cycle analysis of the shMBD2 and shSCR groups of K562 and BV173 cells was performed by flow cytometry and PI staining. Each experiment was repeated three times. (D) The relative distribution of the cell cycle of K562 group cells and BV173 group cells were shown. Each experiment was repeated three times. *, P < 0.05 by Student's t-test.
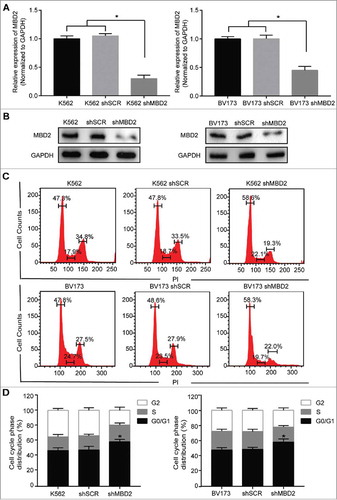
Figure 4. The Effects of MBD2 Deletion on JAK2/STAT3 Signalling Pathways in K562 Cells. The K562 (MBD2 WT vs. MBD2 KO) cells were prepared and subjected to qRT-PCR and WB analysis. (A, B) The mRNA and protein levels of JAK2/ STAT3 signalling pathways were tested in the WT and KO group cells. (C, D) C-Myc, CCND1 and Bcl-xL were measured using qRT-PCR and WB. The quantitative analysis of WB density were shown (B right panel and D right panel). Each experiment was repeated three times. *P < 0.05 and **P < 0.01 by Student's t-test.
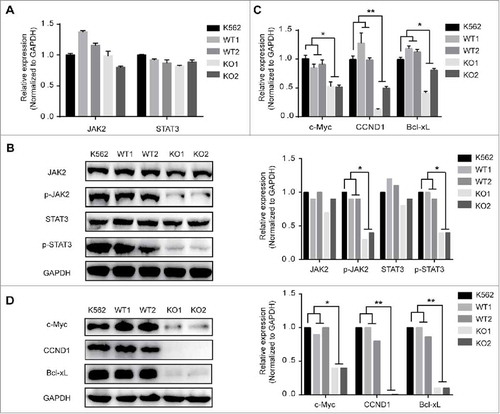
Figure 5. Deletion of MBD2 Impacted CML Cell Proliferation in Vivo. (A) Representative images of tumours at 21 d post-infection are shown. (B) Volume of subcutaneously formed tumours. Tumour volume was calculated as πLW2/6 for 3 weeks. (C) Subcutaneous tumour outgrowth of K562 WT and KO cells. (D) Representative images of haematoxylin and eosin stained section of K562 (MBD2 WT vs. MBD2 KO) cell-produced xenograft tumours, magnification × 400. For immunohistochemical inspection, MBD2 (the middle panel) and Ki67 (the right panel) are shown in the tumour tissues from each group. (E) The protein of the tumour cells was extracted and subjected to Western blot analysis. JAK2, p-JAK2, STAT3 and p-STAT3 were measured to analyse the effect on the JAK2/STAT3 signalling pathway; c-Myc, CCND1 and Bcl-xL were also detected. The data shown are averages of three mice in each group. Each experiment was repeated three times. *, P < 0.05 by Student's t-test.
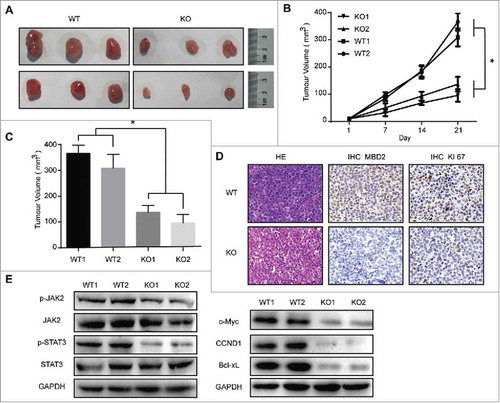
Figure 6. CpG Methylation Levels of the SHP1 Promoter Region in K562, CML-BP patients and healthy controls. The methylation of SHP1 promoter region was read by MBD2 in CML. (A) The mRNA levels of SHP1 in CML-BP, CML-CP patients and healthy controls by qRT-PCR. CpG islands of the SHP-1 promoter region were from -2201 bp to -1814 bp, including 37 CpG sites. (B) The graph represents the average value of methylated rates of the detected region in three healthy controls, three CML-BP patients and K562 cell line. (C) Representative pictures of DNA bisulphite analysis results in healthy controls, CML-BP patients and K562 cell line. Every row represents a distinct clone. Each black or white circle represents a methylated or unmethylated CpG dinucleotide, respectively. (D, E) The expression levels of SHP1 were analysed in K562 (MBD2 WT vs. MBD2 KO) cells by qRT-PCR and WB. (F) By ChIP assay, binding of MBD2 to the SHP1 promoter was demonstrated in K562 and WT1 cells. DNA expression levels were normalized to input group (100%). GAPDH was selected as a negative control. (G-I) SHP1 shRNA and shCON were transfected into MBD2 deficient K562 cells (KO1). (G) qRT-PCR confirmed the down-regulation of SHP1 at the mRNA level. The transcription levels of CCND1, c-Myc and Bcl-xL, the downstream target genes, were analyzed by qRT-PCR. (H) WB analysis of SHP1 and MBD2 expression in WT1, KO1, KO1 shRNA and KO1 shCON cells. (I)The cell cycle was analyzed in WT1, KO1, KO1 shSHP1 and KO1 shCON cells using PI staining. Typical flow cytometry profiles show representative data from three independent experiments. Each experiment was repeated three times. *, P < 0.05 and **, P < 0.01 by Student's t-test.
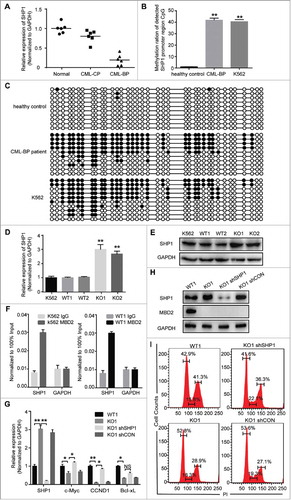
Table 1. The sequences of the primers used in qRT-PCR.