
Figures & data
Figure 1. The association between tumor-infiltrating CD33+MDSC, Foxp3+Treg, IDO expression, and IDO expression in CD33+MDSCs. (a1) CD33 in cancer tissues was expressing in normal cells between cancer cell nests dispersed on membrane and few in cytoplasm in cancer tissues (× 400, red arrows); (a2) negative expression of CD33 in breast cancer tissues (× 400); (a3) negative expression of CD33 in normal breast tissues, which were set as the negative control (NC); (b1) IDO in cancer tissues mainly expressed in tumor cells and some karyocytes dispersed in stroma with brownish yellow staining in cytoplasm (× 400, red arrows); (b2) negative expression of IDO in breast cancer tissues (× 400); (b3) negative control; (c1) in breast cancer tissues, Foxp3 expression in lymphocytes dispersed in stroma with brownish dark yellow staining in nucleus (× 400, red arrows); (c2) negative expression of Foxp3 in breast cancer tissues (× 400); (c3) negative control; (d) co-expression of IDO and CD33 in tumor tissues was determined using immunohistochemical double-staining method; (d1) IDO and CD33 negative staining of breast cancer tissues; (d2) CD33 positive and IDO negative cells (IDO−CD33+) were stained red on membrane (red arrows); (d3) IDO positive and CD33 negative cells (IDO+CD33−) were stained purple in cytoplasm (red arrows); (d4) IDO+CD33+MDSCs were stained red on membrane and purple in cytoplasm (× 400, red arrows); (e1) from the total of 54 patients, 33 patients were positive for CD33+MDSCs, 27 patients were positive for IDO expression (IDO positive, orange; negative, blue), and 22 patients were both positive for CD33+MDSCs and IDO expression. By Spearman's rank correlation test, it was found that CD33+MDSCs were positively correlated with IDO expression (r2 = 0.418, P = 0.002); (e2) 31 patients were positive for Foxp3+Tregs (Foxp3+Treg positive, orange; negative, blue), 33 patients were positive for CD33+MDSCs, 24 patients were positive for both CD33+MDSCs and Foxp3+Tregs. By Spearman's rank correlation test, it was found that CD33+MDSCs were positively correlated with Foxp3+Tregs (r2 = 0.388, P = 0.004); (e3) 31 patients were positive for Foxp3+Tregs, 27 patients were positive for IDO expression, 22 patients were positive for both Foxp3+Treg and IDO expression (IDO positive, orange; negative, blue). By Spearman's rank correlation test, it was found that IDO expression was positively correlated with Foxp3+Tregs (r2 = 0.487, P = 0.000); (f) 31 patients were positive for Foxp3+Tregs, 22 patients were positive for IDO expression in CD33+MDSCs, 20 patients were positive for both Foxp3+Tregs and IDO expression in CD33+MDSCs. By Spearman's rank correlation test, IDO+CD33+MDSCs were positively correlated with Foxp3+Tregs (r2 = 0.528, P = 0.000).
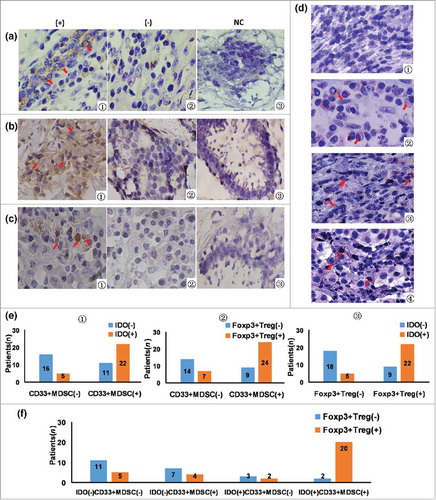
Table 1. The association between tumor-infiltrating CD33+MDSC, Foxp3+Treg, IDO expression and clinicopathological features prior NCT.
Table 2. The association between co-expression of IDO/CD33 and clinicopathological features prior NCT.
Table 3. Univariate analysis of clinicopathological features with respect to breast cancer patients’ response to NCT.
Table 4. Univariate analysis of immunological features with respect to breast cancer patients’ response to NCT.
Table 5. Multivariate analysis of immunological and clinicopathological features with respect to breast cancer patients’ clinical response to NCT.
Table 6. Multivariate analysis of immunological and clinicopathological features with respect to breast cancer patients’ pathological response to NCT.
Figure 2. The survival curves for breast cancer patients treated by NCT. (a) PFS curves arranged by clinical stage (P = 0.021); (b) OS curves arranged by clinical T stage (P = 0.001); (c) PFS curves arranged by tumor-infiltrating CD33+MDSCs (P = 0.225); (d) OS curves arranged by tumor-infiltrating CD33+MDSCs (P = 0.121); (e) PFS curves arranged by IDO expression (P = 0.378); (f) OS curves arranged by IDO expression (P = 0.508); (g) PFS curves arranged by tumor-infiltrating Foxp3+Tregs (P = 0.979); (h) OS curves arranged by tumor-infiltrating Foxp3+Tregs (P = 0.022); (i) PFS curves arranged by IDO expression in CD33+MDSCs (P = 0.354); (j) OS curves arranged by IDO expression in CD33+MDSCs (P = 0.523).
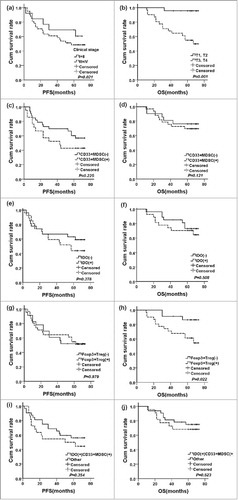
Table 7. COX regression for prognostic significance of immunological features for breast cancer patients.