1,732
Views
3
CrossRef citations to date
0
Altmetric
Research Paper

Ovarian cancer-derived extracellular vesicles affect normal human fibroblast behavior

ORCID Icon, ORCID Icon, ORCID Icon, ORCID Icon, ORCID Icon, ORCID Icon & ORCID Icon show all
Pages 722-734 | Received 07 Mar 2018, Accepted 07 Mar 2018, Published online: 25 Apr 2018

Figures & data

Figure 1. TEM analysis. Transmission electron microscopy images of vesicles isolated from conditioned medium of CABA I (a) and SKOV 3 (b) cells. Displayed vesicles measure 150 nm and 300 nm in and 300 nm in . Bar = 500 nm.
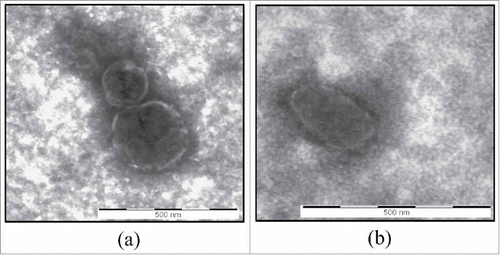
Figure 1. TEM analysis. Transmission electron microscopy images of vesicles isolated from conditioned medium of CABA I (a) and SKOV 3 (b) cells. Displayed vesicles measure 150 nm and 300 nm in Fig. 1a and 300 nm in Fig. 1b. Bar = 500 nm.

Figure 2. Morphological and markers' expression changes of treated fibroblasts. (a) Representative images of cell morphology: first column from the left shows untreated fibroblasts (NHDF), the second and third ones display NHDFCI and NHDFSK, respectively. The 5X objective of an optical inverted microscope was used to capture images of the first two rows, while pictures of the third row were captured with the 10X objective. The scale bar, which is barely visible, has a size of 1000 nm in all the images. (b-c) Western Blot analysis of α-SMA (b) and TIMP-2 (c); molecular weights (kDa) are reported on the left of each image. Densitometric analysis of the signals were perfomed with the program Image J and using GAPDH for the normalization. The values of the ratios are shown at the bottom of each panel and the ratio value was conventionally attributed as 1 in untreated fibroblasts.
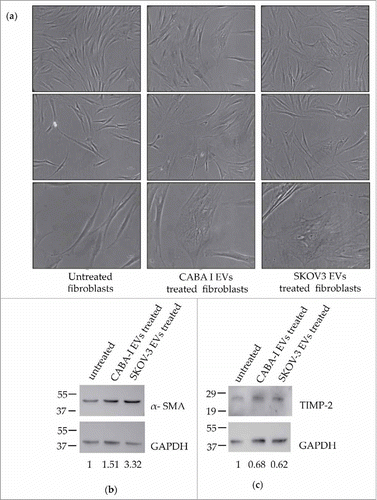
Figure 2. Morphological and markers' expression changes of treated fibroblasts. (a) Representative images of cell morphology: first column from the left shows untreated fibroblasts (NHDF), the second and third ones display NHDFCI and NHDFSK, respectively. The 5X objective of an optical inverted microscope was used to capture images of the first two rows, while pictures of the third row were captured with the 10X objective. The scale bar, which is barely visible, has a size of 1000 nm in all the images. (b-c) Western Blot analysis of α-SMA (b) and TIMP-2 (c); molecular weights (kDa) are reported on the left of each image. Densitometric analysis of the signals were perfomed with the program Image J and using GAPDH for the normalization. The values of the ratios are shown at the bottom of each panel and the ratio value was conventionally attributed as 1 in untreated fibroblasts.

Figure 3. Effects on fibroblasts' proliferation, motility and invasion capabilities. (a) Proliferation test: graphs show proliferation after 96, 168, 264 h; data originated in triplicate and are expressed as mean±SD; the value 100% was assigned to untreated fibroblasts. The statistical significance for each sample was calculated compared to untreated fibroblasts (NHDF), while the horizontal line refers to the statistical significance between NHDFCI and NHDFSK (*p < 0,05; **p < 0,01). (b) The effects of CABA I and SKOV3 derived EVs on fibroblasts' migration determined by wound-healing assay: a summary panel showing fibroblasts' migration in untreated and EVs-treated fibroblasts (rows) after 24, 32 and 48 hours (columns). Images at 0 h represent the initial wound area; dotted lines define the size of the original scratch. (c) Graph shows the % of wounded area 32 hours after the beginning of the assay; the original scratch area was conventionally assumed as 100%. The area of the scratch was measured through the software Image J and values were shown as mean±SD of three independent experiments. (d) The number of invaded fibroblasts through the Matrigel coated filter was counted in 5 random fields per each well of the modified Boyden chamber with the objective 20X of an inverted optical microscope. Data are reported as mean±SD; the statistical analysis was referred to untreated fibroblasts (NHDF), whose invasion was conventionally set as 100%. (**p < 0,01).
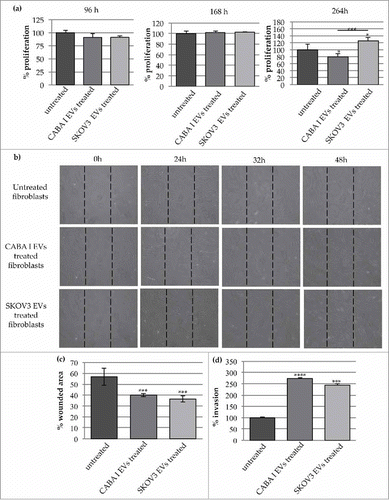
Figure 3. Effects on fibroblasts' proliferation, motility and invasion capabilities. (a) Proliferation test: graphs show proliferation after 96, 168, 264 h; data originated in triplicate and are expressed as mean±SD; the value 100% was assigned to untreated fibroblasts. The statistical significance for each sample was calculated compared to untreated fibroblasts (NHDF), while the horizontal line refers to the statistical significance between NHDFCI and NHDFSK (*p < 0,05; **p < 0,01). (b) The effects of CABA I and SKOV3 derived EVs on fibroblasts' migration determined by wound-healing assay: a summary panel showing fibroblasts' migration in untreated and EVs-treated fibroblasts (rows) after 24, 32 and 48 hours (columns). Images at 0 h represent the initial wound area; dotted lines define the size of the original scratch. (c) Graph shows the % of wounded area 32 hours after the beginning of the assay; the original scratch area was conventionally assumed as 100%. The area of the scratch was measured through the software Image J and values were shown as mean±SD of three independent experiments. (d) The number of invaded fibroblasts through the Matrigel coated filter was counted in 5 random fields per each well of the modified Boyden chamber with the objective 20X of an inverted optical microscope. Data are reported as mean±SD; the statistical analysis was referred to untreated fibroblasts (NHDF), whose invasion was conventionally set as 100%. (**p < 0,01).

Figure 4. Zymography assays. (a) Gelatin zymography was performed for MMP-2 and MMP-9 detection. (b) casein-plasminogen zymography was performed for Plasminogen Activators (PAs) detection. Levels of pro-MMP-2 (∼72 kDa) and HMW-uPA(∼50 kDa) were quantified by densitometric analysis in all samples. Values are reported on the bottom of figures, and are in proportion to the band of untreated fibroblast (NHDF) that was set conventionally at 1.
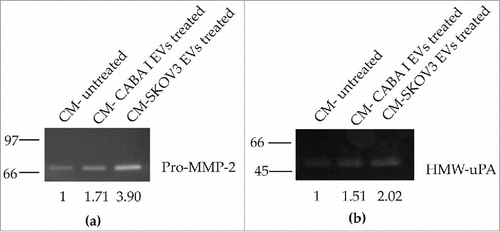
Figure 4. Zymography assays. (a) Gelatin zymography was performed for MMP-2 and MMP-9 detection. (b) casein-plasminogen zymography was performed for Plasminogen Activators (PAs) detection. Levels of pro-MMP-2 (∼72 kDa) and HMW-uPA(∼50 kDa) were quantified by densitometric analysis in all samples. Values are reported on the bottom of figures, and are in proportion to the band of untreated fibroblast (NHDF) that was set conventionally at 1.

Figure 5. Scanning Electron Microscopy (SEM). The first upper row is composed of low-magnification images, the second one shows some details of the cell surface at higher magnification, clearly exhibiting the phenomenon of the shedding of microvesicles. Reported images are representative of the experiments that evidenced in NHDFCI and NHDFSK an abundant microvesicles release on the cell surface, while in untreated fibroblasts (NHDF) shedding of microvesicles was extremely sporadic.
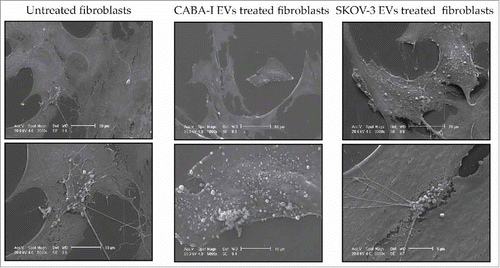
Figure 5. Scanning Electron Microscopy (SEM). The first upper row is composed of low-magnification images, the second one shows some details of the cell surface at higher magnification, clearly exhibiting the phenomenon of the shedding of microvesicles. Reported images are representative of the experiments that evidenced in NHDFCI and NHDFSK an abundant microvesicles release on the cell surface, while in untreated fibroblasts (NHDF) shedding of microvesicles was extremely sporadic.

Figure 6. Effects of the CM from untreated and treated fibroblasts on neighbouring fibroblasts (a): proliferation of fibroblast treated with CM NHDF, CM NHDFCI and CM NHDFSK. Data (means±SD) were represented as percentage and the proliferation of fibroblasts treated with CM NHDF was set 100%. (b): fibroblasts migration assay in presence of CM from untreated and EVs treated fibroblasts. Data (means±SEM) were represented as percentage and the migration of fibroblasts treated with CM-untreated was set 100%. (**p < 0,01).
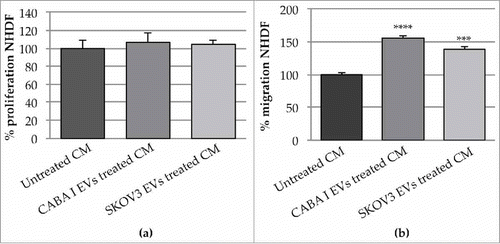
Figure 6. Effects of the CM from untreated and treated fibroblasts on neighbouring fibroblasts (a): proliferation of fibroblast treated with CM NHDF, CM NHDFCI and CM NHDFSK. Data (means±SD) were represented as percentage and the proliferation of fibroblasts treated with CM NHDF was set 100%. (b): fibroblasts migration assay in presence of CM from untreated and EVs treated fibroblasts. Data (means±SEM) were represented as percentage and the migration of fibroblasts treated with CM-untreated was set 100%. (**p < 0,01).

Figure 7. Effects of the CM from untreated and treated fibroblasts on neighbouring cancer cells. (a-b) The proliferation of CABA I (a) and SKOV3 (b) was tested in presence of the CM NHDF, CM NHDFCI and CM NHDFSK. Data are shown as mean ± SD and were representative of three independent experiments. 100% proliferation was assigned to ovarian cancer cells treated with CM NHDF. (c-d) Migration ability of ovarian cancer cells, CABA I (c) and SKOV3 (d) cells, following exposure to CM NHDF, CM NHDFCI and CM NHDFSK, through a modified Boyden chamber. Data are expressed as mean ± SEM and the value 100% migration was assigned to cells migrating in response to the CM NHDF. (e-f) The in vitro cell invasion assay, performed with the modified Boyden chamber, of CABA I (e) and SKOV3 (f) cells. Data, expressed as mean ± SEM, were shown as percentage of invading cells and 100% invasion was attributed to fibroblasts invading towards CM NHDF (*p < 0,05; **p < 0,01).
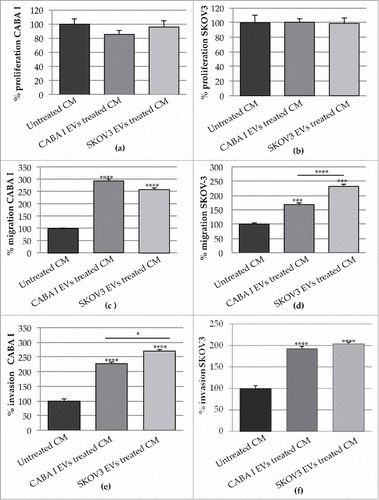
Figure 7. Effects of the CM from untreated and treated fibroblasts on neighbouring cancer cells. (a-b) The proliferation of CABA I (a) and SKOV3 (b) was tested in presence of the CM NHDF, CM NHDFCI and CM NHDFSK. Data are shown as mean ± SD and were representative of three independent experiments. 100% proliferation was assigned to ovarian cancer cells treated with CM NHDF. (c-d) Migration ability of ovarian cancer cells, CABA I (c) and SKOV3 (d) cells, following exposure to CM NHDF, CM NHDFCI and CM NHDFSK, through a modified Boyden chamber. Data are expressed as mean ± SEM and the value 100% migration was assigned to cells migrating in response to the CM NHDF. (e-f) The in vitro cell invasion assay, performed with the modified Boyden chamber, of CABA I (e) and SKOV3 (f) cells. Data, expressed as mean ± SEM, were shown as percentage of invading cells and 100% invasion was attributed to fibroblasts invading towards CM NHDF (*p < 0,05; **p < 0,01).

Figure 8. Effects of the CM NHDF, CM NHDFCI and CM NHDFSK on motility and proliferation of neighbouring HUVEC cells. (a): The scratch area was monitored at multiple times over a 24 hours-period. Images of the most significant time intervals (beginning point = 0 hour, 7 hours later, 9 hours later and 24 hours) were captured. Dotted lines represent the size of original scratch. (b): Graph showing the % of wound area of the scratch at 24 hours after the creation of the scratch (0 h) (original wounded area was set, for each condition, as 100%). The percentages of the scratch area were calculated as mean±SD of three independent experiments (**p < 0,01). (c): The proliferation was measured and expressed as percentage of proliferating HUVECs. The value 100% proliferation was assigned to CM NHDF-treated HUVEC (*p < 0,05).
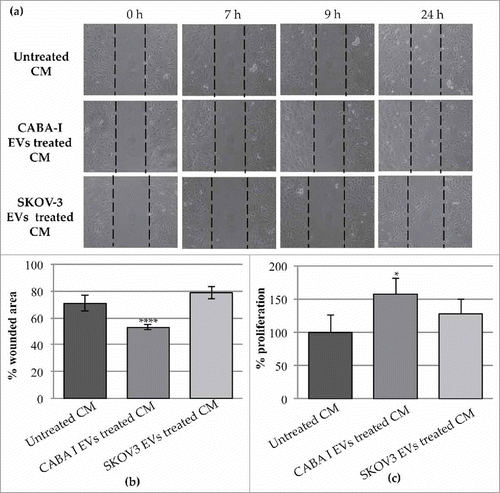
Figure 8. Effects of the CM NHDF, CM NHDFCI and CM NHDFSK on motility and proliferation of neighbouring HUVEC cells. (a): The scratch area was monitored at multiple times over a 24 hours-period. Images of the most significant time intervals (beginning point = 0 hour, 7 hours later, 9 hours later and 24 hours) were captured. Dotted lines represent the size of original scratch. (b): Graph showing the % of wound area of the scratch at 24 hours after the creation of the scratch (0 h) (original wounded area was set, for each condition, as 100%). The percentages of the scratch area were calculated as mean±SD of three independent experiments (**p < 0,01). (c): The proliferation was measured and expressed as percentage of proliferating HUVECs. The value 100% proliferation was assigned to CM NHDF-treated HUVEC (*p < 0,05).

Reprints and Corporate Permissions

Please note: Selecting permissions does not provide access to the full text of the article, please see our help page How do I view content?

To request a reprint or corporate permissions for this article, please click on the relevant link below:

Academic Permissions

Please note: Selecting permissions does not provide access to the full text of the article, please see our help page How do I view content?

Obtain permissions instantly via Rightslink by clicking on the button below:

If you are unable to obtain permissions via Rightslink, please complete and submit this Permissions form. For more information, please visit our Permissions help page.