Figures & data
Table 1. Characteristics of patients with GBCa.
Table 2. GBCa profile.
Table 3. Comparison between mutation analysis and cytology with bile.
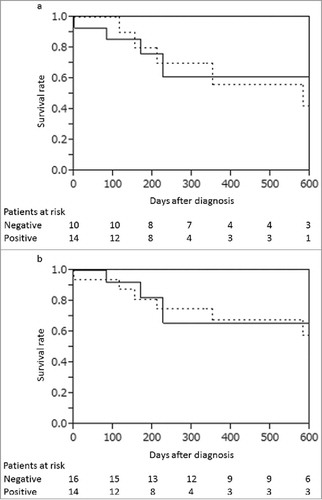
Figure 1. (a) The survival rates of the patients with bile ctDNA positive (solid line) and with bile ctDNA negative (dotted line). The survival rates were not significantly different (P = 0.90). (b) The survival rates of the patients with bile cytology class 5 positive (solid line) and negative (dotted line). The survival rates were not significantly different (P = 0.80).