Figures & data
Table 1. Clinicopathological characteristics of the colon cancer patients.
Figure 1. Experimental design. (a) Gating strategy of cancer stem cell (CSC) and differentiated tumor cell (DTC) isolation by FACS. Tumor cells were separated on the basis of the CD45− phenotype, and tumor-infiltrating lymphocytes were eliminated. CSCs were identified as CD45−EpCAMhighCD44+, whereas DTCs were CD45−EpCAMhighCD44−. (b) Fluorescence signals of CSCs and DTCs under confocal microscopy.
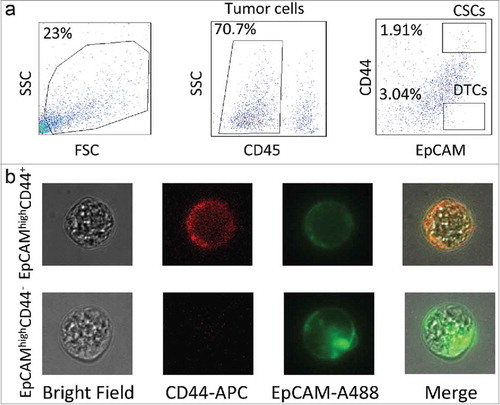
Figure 2. The median of the absolute values of all pairwise differences (MAPD) scores of single-cell libraries in each patient. (a) Comparison between the fixed and variable bin methods. (b) Comparisons between cancer stem cells (CSCs) and differentiated tumor cells (DTCs) in each method. F: fixed bin method; V: variable bin method.
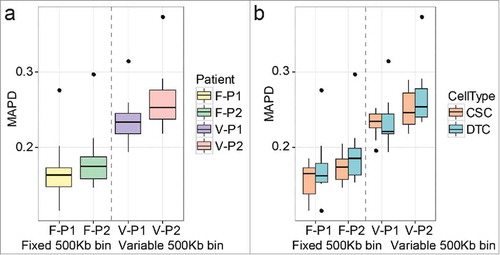
Figure 3. Somatic copy number alteration (SCNA) profiles of cancer stem cells (CSCs) and differentiated tumor cells (DTCs) analyzed by two methods. Single cells from the same patient clustered in the same group. The SCNA profiles of the two populations within one tumor were highly similar. The clusters were based on the Euclidean distance and ward.D method.
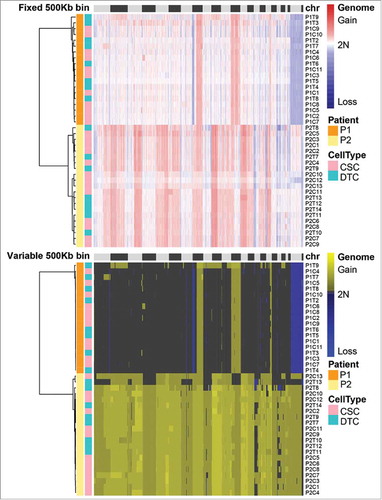
Figure 4. Comparison of the cancer stem cell (CSC) and differentiated tumor cell (DTC) populations from each patient. The correlation values of each population are shown in the boxplot diagram. The p-value was calculated according to a two-tailed Mann-Whitney U test. (a) Fixed bin method; (b) variable bin method.
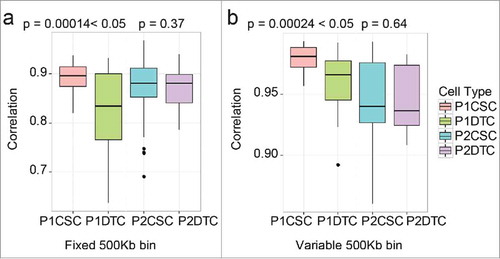
Figure 5. Regional differences of somatic copy number alterations (SCNAs) analyzed by two methods in patient 1 (P1). Amplification of chr4p16.2-4p14 containing the cancer-associated gene RAB28. Amplification of chr8q24.1-q24.3 containing the cancer-associated genes MYC, CCAT2, and WISP1.
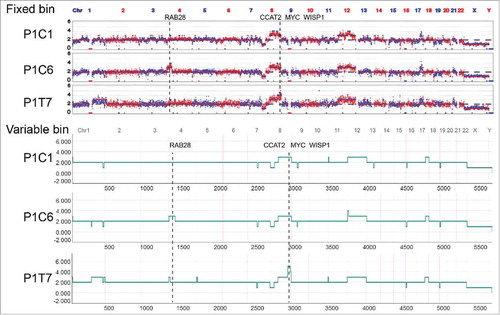
Figure 6. Somatic copy number alteration (SCNA) profiles of cancer stem cells (CSCs) analyzed by two methods. CSCs from the same patient clustered in the same group. The SCNA profiles of the CSCs within one tumor were highly reproducible. The clusters were based on the Euclidean distance and ward.D method.
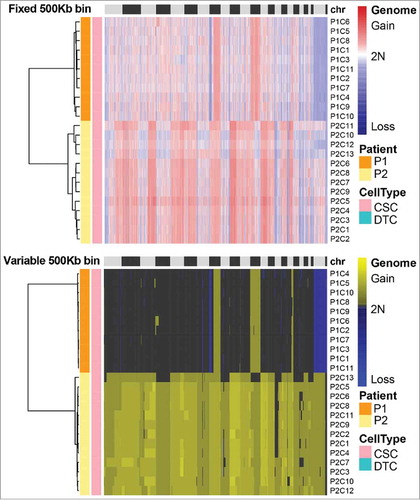
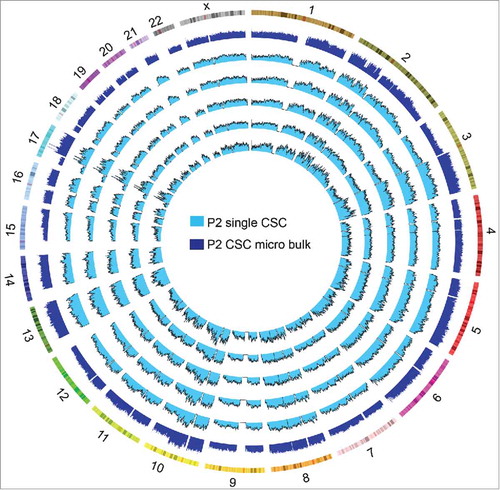
Figure 7. SCNA profiles of the cancer stem cells (CSCs) and the micro bulk in patient 2 (P2).