Figures & data
Figure 1. Overexpression of DUXAP10 is a significant prognostic factor in ESCC. A. The expression levels of DUXAP10 in ESCC tissues and in the normal tissues were tested with qRT-PCR. B. The expression of DUXAP10 was detected in ESCC cells (KYSE30, KYSE510, KYSE180 and KYSE150) and one normal cell (NE1). C. Kaplan Meier analysis was utilized to analyze the correlation between survival time of ESCC patients and DUXAP10 expression. Error bars represent the mean ± SD of at least three independent experiments. **P< 0.01 vs. control group.
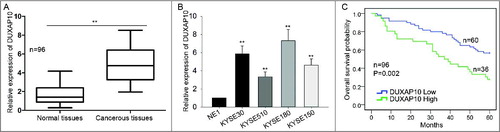
Table 1. Correlation between DUXAP10 expression and clinical features of ESCC patients. (n = 96)
Table 2. Multivariate analysis of prognostic parameters in ESCC patients by Cox regression analysis
Figure 2. Knockdown of DUXAP10 negatively influences ESCC cell proliferation. A. The expression of DUXAP10 was interfered in KYSE30 and KYSE180 with shRNAs. The lowest expression was observed after transfection for about two days. B-C. Results of MTT and colony formation assay showed the decreased cell proliferation after DUXAP10 was down-expressed in KYSE30 and KYSE180 cells. Error bars represent the mean ± SD of at least three independent experiments. **P< 0.01 vs. control group.
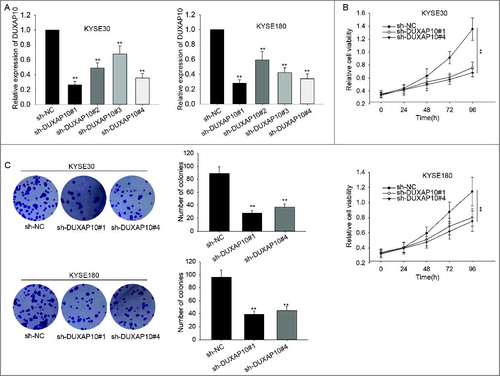
Figure 3. The influence of silenced DUXAP10 on cell cycle distribution and cell apoptosis. A. Cell cycle was stagnated at G0/G1 phase in DUXAP10 downregulated ESCC cells. B. cell apoptosis was accelerated in ESCC cells in which DUXAP10 was downregulated. Error bars represent the mean ± SD of at least three independent experiments. **P< 0.01 vs. control group.
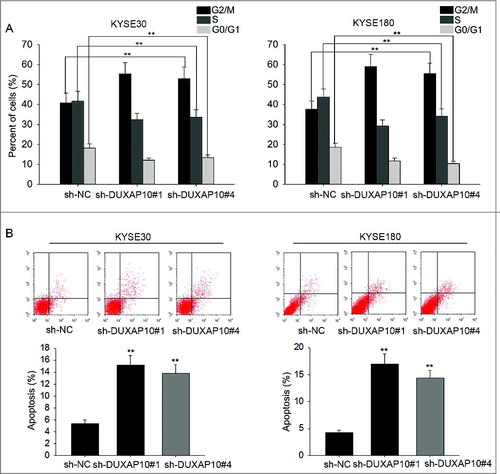
Figure 4. DUXAP10 epigenetically silences p21 expression by binding with EZH2. A. Fractionation assays were utilized to examine the localization of DUXAP10 in ESCC cells. B. RIP assay was conducted to demonstrate the combination between DUXAP10 and EZH2 in ESCC cells. C. P21 was mostly upregulated after DUXAP10 was silenced in ESCC cells. D-E. We could observe that the mRNA level and protein level of p21 was largely reduced by transfection of pcDNA-DUXAP10 while recovered again by adding EZH2 inhibitors. F. ChIP analysis showed us interference of DUXAP10 expression weakened the ability to bind and to modify H3K4me2 demethylation. Error bars represent the mean ± SD of at least three independent experiments. **P< 0.01 vs. control group.
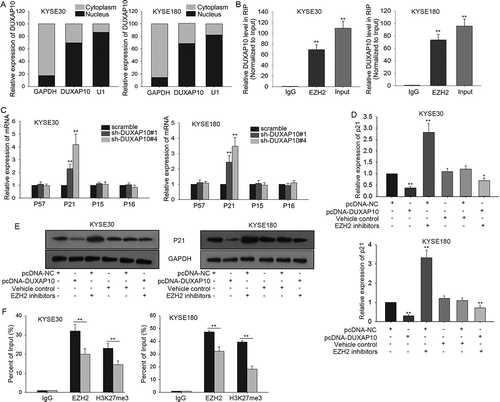
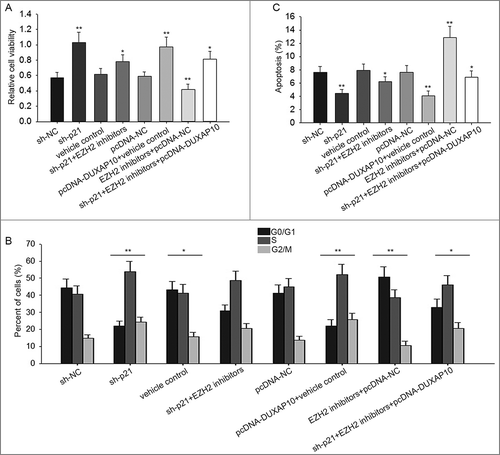
Figure 5. Modulation of DUXAP10-EZH2-p21 axis affects cell proliferation, cell cycle and cell apoptosis. A. Result of MTT assay in p21 downregulated KYSE30 cell manifested the increased cell proliferation largely reduced by adding EZH2 inhibitors, while recovered again with EZH2 inhibitors+pcDNA-DUXAP10. B. Results of flow cytometry analysis made us realize that the accelerated cell cycle was stagnated by EZH2 inhibitors, while was motivated again by transfection of EZH2 inhibitors+pcDNA-DUXAP10. C. Decreased apoptosis was promoted by adding EZH2 inhibitors while was suppressed again by transfection of EZH2 inhibitors+pcDNA-DUXAP10. Error bars represent the mean ± SD of at least three independent experiments. **P< 0.01 vs. control group.