Figures & data
Figure 1. Chronic exposure to cigarette smoke and chewing tobacco induces phenotypic changes in oral keratinocytes. A. Cellular morphology of OKF6/TERT1-Parental cells, OKF6/TERT1-Smoke-8M and OKF6/TERT1-Tobacco-8M cells (magnification 20X) B. Growth curve depicting cellular proliferation rates of OKF6/TERT1-Parental, OKF6/TERT1-Smoke-8M and OKF6/TERT1-Tobacco-8M cells. C. Western blot analysis of EMT markers –E-cadherin and Slug. β-actin was used as loading control. D. Invasive ability of OKF6/TERT-Parental and OKF6/TERT1-Smoke-8M cells and E. Invasive ability of OKF6/TERT1 and OKF6/TERT1-Tobacco-8M cells. Representative images were photographed for each time point at 10x magnification. Invaded cells were counted and relative changes in invasive ability of OKF6/TERT1-Smoke-8M and OKF6/TERT1-Tobacco-8M cells at the indicated time points were calculated and represented graphically (***p < 0.0001).
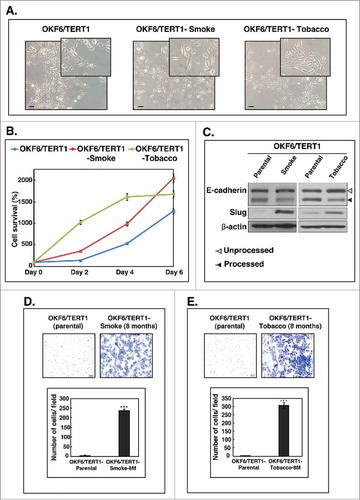
Figure 2. Exome sequencing of OKF6/TERT1-Smoke-8M and OKF6/TERT1-Tobacco-8M cells. A. Transitions and transversions observed in OKF6/TERT1-Smoke-8M and OKF6/TERT1-Tobacco-8M compared to OKF6/TERT1-Parental cells. B. Visual representation of log2 normalized read counts and annotated copy number profile in OKF6/TERT1-Smoke-8M cells relative to OKF6/TERT1-Parental cells. Each dot corresponds to an amplicon. Color code – green dots: outliers; dark grey surroundings: unchanged amplicons; plum color surroundings: 1-level gain; all purple dots above the red dotted line represent copy number amplifications >1-level gain in OKF6/TERT1-Smoke-8M cells. C. Visual representation of log2 normalized read counts and annotated copy number profile in OKF6/TERT1-Tobacco-8M cells relative to OKF6/TERT1-parental cells. Each dot corresponds to an amplicon. Color code – green dots: outliers; dark grey surroundings: unchanged amplicons; plum color surroundings: 1-level gain; all purple dots above the red dotted line represent copy number amplifications>1-level gain in OKF6/TERT1-Tobacco-8M cells.
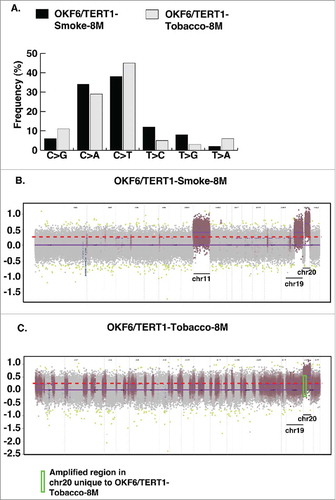
Figure 3. Workflow employed to identify proteomic alterations in normal oral keratinocytes chronically exposed to cigarette smoke for increasing durations of time (2-4-6-8 months). Proteins were extracted and quantified from OKF6/TERT1-Parental, OKF6/TERT1-Smoke-2M, OKF6/TERT1-Smoke-4M, OKF6/TERT1-Smoke-6M and OKF6/TERT1-Smoke-8M cells. In-solution trypsin digestion of equal amount of proteins from each condition was performed and peptides from OKF6/TERT1-Parental, OKF6/TERT1-Smoke-2M, OKF6/TERT1-Smoke-4M, OKF6/TERT1-Smoke-6M and OKF6/TERT1-Smoke-8M were labeled with TMT reagents 128N, 128C, 129N, 129C and 130N, respectively. Labeled samples were pooled, fractionated using basic reversed phase liquid chromatography and fractions were analyzed in triplicate by mass spectrometry.
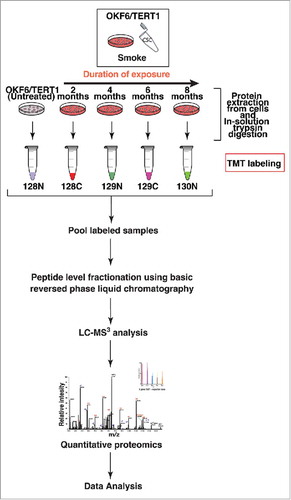
Figure 4. Cluster analysis of smoke and tobacco exposed cells Principle component analysis of A. OKF6/TERT1-Parental and OKF6/TERT1-Smoke (2-4-6-8 months) and B. OKF6/TERT1-Parental and OKF6/TERT1-Tobacco (2-4-6-8 months) cells, C. Heat map depicting the expression pattern of proteins significantly dysregulated (p<0.05) in all three replicates of OKF6/TERT1-Smoke-8M and/or OKF6/TERT1-Tobacco-8M.
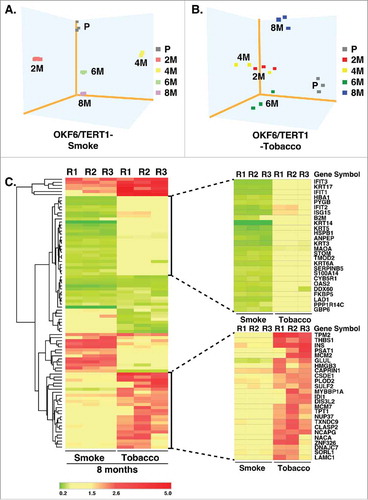
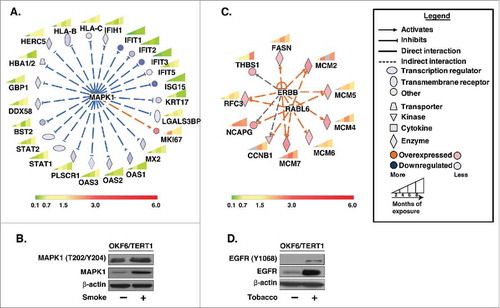
Figure 5. Bioinformatics analysis of dysregulated proteins in smoke and tobacco exposed cells A. Ingenuity pathway analysis of proteins significantly dysregulated (p < 0.05) in cigarette smoke exposed cells B. Western blot analysis of phospho MAPK1 (T202/Y204) and total MAPK1 levels in smoke exposed (8 months) cells compared to parental cells. β-actin was used as loading control C. Ingenuity pathway analysis of proteins significantly dysregulated (p < 0.05) in chewing tobacco exposed cells D. Western blot analysis of phospho EGFR (Y1068) and total EGFR levels in chewing tobacco exposed (8 months) cells compared to parental cells. β-actin was used as loading control.