
Figures & data
Figure 1. Computed tomography (CT) and magnetic resonance imaging (MRI) scans from Patient 1. The CT scans show the right renal cell carcinoma (RCC) and left pheochromocytoma before (A, C) and after (B, D) sunitinib treatment. The MRI scans show the hemangioblastoma in the right cerebellum before sunitinib treatment (E) and the CT scan shows the site of the lesion after the operation (F). Red arrows indicate the masses.
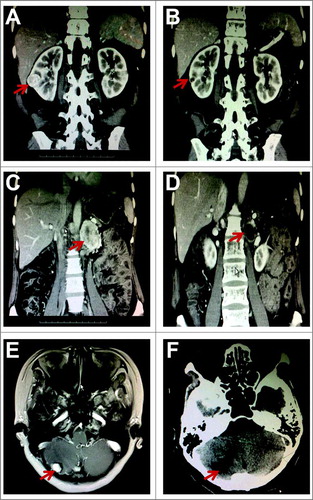
Figure 2. Computed tomography (CT) scans from Patient 2. The CT scans show multiple right renal cell carcinomas (RCCs) before and after sunitinib treatment, including the masses around the renal hilum (A and E), lower ventral (B and F), dorsal, lower dosal (C and G), superior pole (D and H). Red arrows indicate the masses.
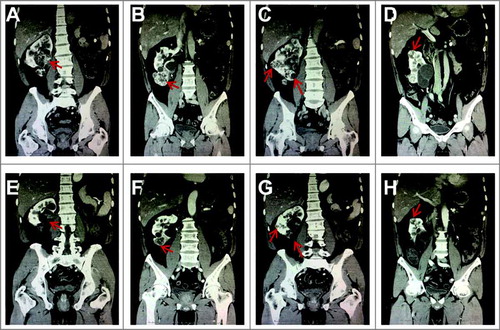
Figure 3. Magnetic resonance imaging (MRI) and computed tomography (CT) scans from Patient 3. The MRI scans show multiple RCCs in the left kidney including RCC in the dorsal of the kidney (A and E), ventral of the kidney and beside the spine (B and F), as well as three pancreatic lesions (C and G) before and after sunitinib treatment. The CT scans show the lesion on her back before and after sunitinib treatment (D and H). Red arrows indicate the masses.
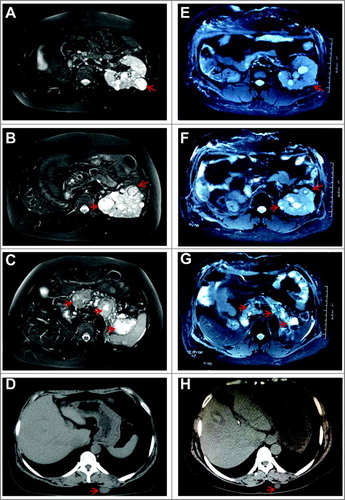
Table 1. Characteristics of three patients with VHL disease
Table 2. Changes of the masses in the Patients
Table 3. Treatment-emergent adverse side effects