Figures & data
Figure 1. Chemical structure and biochemical activity of SN202. (A) The chemical structure of SN202. Inhibition rate of SN202 on kinase activity of mTOR (B), PI3Kα (C) and PI3Kγ (D).
Table 1. In vitro IC50 values for SN202 against recombinant PI3-kinases and mTOR
Figure 2. Inhibition of Akt and S6K phosphorylation by SN202. 786-0 cells were incubated for the indicated time periods with 10 µM SN202. Zero time samples were treated with DMSO. These cells were harvested and analyzed by Western blot using antibodies specific for either serine- or threonine-phosphorylated S6K and Akt. β-actin was used as a loading control. Results are expressed as the mean ± SEM of three independent experiments. One-way ANOVA for SN202 treatment versus the control group: *P < 0.05, **P< 0.01.
Figure 3. Inhibition potential of SN202 against RCC. The inhibitory effect of SN202 on cell proliferation was determined by CCK-8 assay. 786-0 (A), ACHN (B) and A498 (C) cells were treated with varying concentrations of SN202, BKM120 and BEZ235. Data are presented as the means of three independent experiments.
Table 2. In vitro IC50 values for SN202 against three renal cancer cell lines
Figure 4. Inhibition of 786-0 cell cycle progression by SN202. (A) and (C) 786-0 cells were treated with 8 μM SN202 for 8, 16, and 24 h. (B) and (D) 786-0 cells were incubated in the presence of 1, 3, and 8 μM SN202 for 16 h. Cell cycle was determined by a flow cytometry using propidium iodide staining. Results are representative of three independent experiments at minimum.
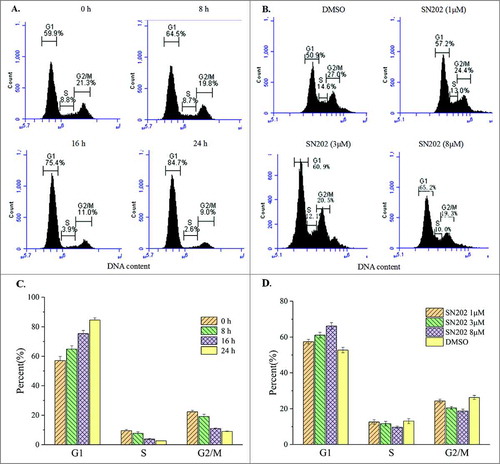
Figure 5. Inhibition of tumor growth by SN202 in 786-0 xenograft model. (A) Mean tumor volume after the start of treatment. (B) Mean body weight of mice after the start of treatment. (C) Tumors resected from nude mice on 21 d. Renal carcinoma 786-0 cells (106 cells) were implanted into the left armpit of each nude mouse to develop tumors. Mice bearing tumors around 120 mm3 were orally treated with SN202 (5 mg/kg and 20 mg/kg) once per day for 21 days. Tumor volume and body weight were recorded twice per week. Data are expressed as mean ± SEM. **P< 0.01 versus the vehicle group.
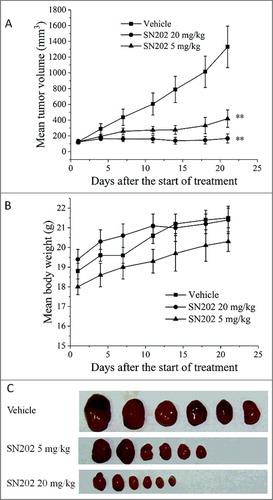
Figure 6. Mean plasma concentration-time profile of SN202 after iv or oral administration. Rats were given a single iv bolus at 1 mg/kg or a single oral administration at 2 mg/kg. At the indicated times after dosing, blood samples were obtained via tail vein of individual rats. Plasma was separated and then determined by LC/MS/MS.