Figures & data
Figure 1. PARP1 inhibitors kill ovarian and breast cancer cells. a. Tumor cells were treated with vehicle control or with niraparib (2.0 μM). After 12h and 24h, cells were isolated and viability determined by trypan blue exclusion (n = 3 +/- SD). b. Tumor cells were treated with vehicle control or with olaparib (2.0 μM) or with cobimetinib (100 nM). After 12h and 24h, cells were isolated and viability determined by trypan blue exclusion (n = 3 +/- SD).
Figure 2. Niraparib activates an ATM-AMPK-ULK1-autophagy pathway. Spiky ovarian cancer cells were treated with vehicle control or niraparib (2 μM), for 4h and 8h. Cells were fixed in place and at least forty cells per condition were imaged in independent triplicate and the intensity ratio of phosphorylated protein levels to total protein expression plotted as a percentage of control treatment (n = 3 +/- SD). # p < 0.05 greater than vehicle control; * p < 0.05 less than vehicle control.
Figure 3. Niraparib reduces the expression of MCL-1 and BCL-XL, enhances BIM levels, and promotes autophagic flux. a. Spiky ovarian cancer cells and SUM149 and BT474 mammary tumor cells were treated with vehicle control or niraparib (2 μM), for 4h and 8h. Cells were fixed in place and at least forty cells per condition were imaged in independent triplicate and the intensity ratio of phosphorylated protein levels to total protein expression plotted as a percentage of control treatment (n = 3 +/- SD). # p < 0.05 greater than vehicle control; * p < 0.05 less than vehicle control. b. Tumor cells were transfected with a plasmid to express LC3-GFP-RFP. Twenty-four h after transfection cells were treated with vehicle control or with niraparib (2 μM) for 4h and 8h. At each time point the mean number of intense GFP+ and RFP+ punctae were determined in at least 40 cells in independent triplicate (n = 3 +/- SD).
Figure 4. Niraparib causes tumor cell killing is reduced by knock down of ATM, AMPK, Beclin1, ATG5 and AIF. a. and b. BT474 and SUM149 mammary cancer cells were transfected with a scrambled siRNA (siSCR) or with validated siRNA molecules to knock down expression of the indicated proteins. In parallel, other portions of cells were transfected to express empty vector (CMV) or to express the indicated proteins. Twenty-four h after transfection cells were treated with vehicle control or with niraparib (2.0 μM) for an additional 24h. Cells were treated with live/dead reagent and the percentage cell death under each condition above that in vehicle control plotted (n = 3 +/- SD). * p < 0.05 less cell death than in the corresponding value in siSCR/CMV treated cells ** p < 0.05 less than corresponding value in cells expressing c-FLIP-s.
Figure 5. Knock down of ATM or AMPK prevents the dephosphorylation of ULK-1 S757, mTOR S2448 and mTOR S2481, and the phosphorylation of ULK-1 S317. A. and B. Spiky ovarian cancer cells and BT474 mammary cancer cells were treated with vehicle control or with niraparib (2.0 μM), for 6h. Cells were fixed in place and at least forty cells per condition were imaged in independent triplicate and the intensity ratio of phosphorylated protein levels to total protein expression plotted as a percentage of control treatment (n = 3 +/- SD). # p < 0.05 greater than vehicle control; * p < 0.05 less than vehicle control.
Figure 6. Autophagy and lysosomal proteases, downstream of ATM and ATG13, play key roles in niraparib lethality. a. and b. Spiky and BT474 cells were transfected with a scrambled siRNA control or with siRNA molecules to knock down the expression of ATM or AMPKα. After 24h they were treated with vehicle control or with niraparib (2.0 μM). Cells were fixed in place and at least forty cells per condition were imaged in independent triplicate and the intensity ratio of phosphorylated protein levels to total protein expression plotted as a percentage of control treatment (n = 3 +/- SD). # p < 0.05 greater than vehicle control. c. Spiky ovarian cancer cells were transfected with a scrambled siRNA control or with siRNA molecules to knock down the expression of ATM or AMPKα. After 24h they were treated with vehicle control or with niraparib (2.0 μM). Cells were fixed in place and at least forty cells per condition were imaged in independent triplicate and the intensity ratio of phosphorylated protein levels to total protein expression plotted as a percentage of control treatment (n = 3 +/- SD). d. Spiky and BT474 cells were transfected with an empty vector control plasmid or with a plasmid to express activated mTOR. Twenty-four h after transfection cells were treated with vehicle control or with niraparib (2.0 μM). Cell viability after 24h of incubation was determined by live/dead assay (n = 3 +/- SD). * p < 0.05 less than corresponding value in CMV transfected cells. e. Spiky and BT474 cells were transfected with a scrambled siRNA (siSCR) or with siRNA molecules to knock down the expression of cathepsin B or eIF2α. Twenty-four h after transfection cells were treated with vehicle control or with niraparib (2.0 μM). Cell viability after 24h of incubation was determined by live/dead assay (n = 3 +/- SD). * p < 0.05 less than corresponding value in siSCR cells.
Figure 7. Sodium valproate enhances niraparib lethality. a. Tumor cells were treated with vehicle control, niraparib (2.0 μM), sodium valproate (250 μM) or the drugs in combination for 24h. Cells were isolated and viability determined by live/dead assay (n = 3 +/- SD). b. Tumor cells were treated with vehicle control, niraparib (2.0 μM), sodium valproate (250 μM) or the drugs in combination for 24h. Cells were isolated and viability determined by a trypan blue exclusion assay (n = 3 +/- SD).
Figure 8. The [niraparib + valproate] combination activates cytosolic ATM which is associated with elevated activation of AMPK and ULK-1, and enhanced inactivation of mTOR, AKT, ERK1/2 and STAT3. Upper Images: Spiky ovarian cancer cells were treated with vehicle control, niraparib (2.0 μM), sodium valproate (250 μM) or the drugs in combination for 6h. Cells were fixed in place and at least forty cells per condition were imaged in independent triplicate and the intensity ratio of phosphorylated protein levels to total protein expression indicated as a percentage of control treatment (n = 3 +/- SD). # p < 0.05 greater than vehicle control; * p < 0.05 less than vehicle control. Lower Graph: Spiky ovarian cancer cells were treated with vehicle control, niraparib (2.0 μM), sodium valproate (250 μM) or the drugs in combination for 6h. Cells were fixed in place and at least forty cells per condition were imaged in independent triplicate and the intensity ratio of phosphorylated protein levels to total protein expression plotted as a percentage of control treatment (n = 3 +/- SD). # p < 0.05 greater than vehicle control; * p < 0.05 less than vehicle control.
![Figure 8. The [niraparib + valproate] combination activates cytosolic ATM which is associated with elevated activation of AMPK and ULK-1, and enhanced inactivation of mTOR, AKT, ERK1/2 and STAT3. Upper Images: Spiky ovarian cancer cells were treated with vehicle control, niraparib (2.0 μM), sodium valproate (250 μM) or the drugs in combination for 6h. Cells were fixed in place and at least forty cells per condition were imaged in independent triplicate and the intensity ratio of phosphorylated protein levels to total protein expression indicated as a percentage of control treatment (n = 3 +/- SD). # p < 0.05 greater than vehicle control; * p < 0.05 less than vehicle control. Lower Graph: Spiky ovarian cancer cells were treated with vehicle control, niraparib (2.0 μM), sodium valproate (250 μM) or the drugs in combination for 6h. Cells were fixed in place and at least forty cells per condition were imaged in independent triplicate and the intensity ratio of phosphorylated protein levels to total protein expression plotted as a percentage of control treatment (n = 3 +/- SD). # p < 0.05 greater than vehicle control; * p < 0.05 less than vehicle control.](/cms/asset/b3ce83f7-6e70-486f-8060-1a5b851f69e4/kcbt_a_1472190_f0008_oc.jpg)
Figure 9. Valproate enhances the ability of niraparib to cause autophagy and CD95 activation. a. Spiky ovarian cancer cells were transfected with a plasmid to express LC3-GFP-RFP. Twenty-four h after transfection cells were treated with vehicle control, niraparib (2 μM), valproate (250 μM) or the drugs in combination for 4h and 8h. At each time point the mean number of intense GFP+ and RFP+ punctae were determined in at least 40 cells in independent triplicate (n = 3 +/- SD). b. and c. Spiky cancer cells were transfected with a scrambled siRNA control (siSCR) or with validated siRNA molecules to knock down the expression of the indicated proteins. In parallel cells were also transfected with an empty vector plasmid (CMV) or with plasmids to express c-FLIP-s, BCL-XL or dominant negative caspase 9. Twenty-four h after transfection cells were treated with vehicle control or with [niraparib (2 μM) + valproate (250 μM)] in combination for 24h. Cells were isolated and viability determined by trypan blue exclusion (n = 3 +/- SD). d. Spiky cancer cells were treated with vehicle control, niraparib (2 μM), valproate (250 μM) or the drugs in combination, as indicated for up to 6h. At each indicated time point, cells were fixed in place and not permeabilized. Immunostaining was performed to detect the cell surface levels of the death receptor CD95 (n = 3 +/- SD).
![Figure 9. Valproate enhances the ability of niraparib to cause autophagy and CD95 activation. a. Spiky ovarian cancer cells were transfected with a plasmid to express LC3-GFP-RFP. Twenty-four h after transfection cells were treated with vehicle control, niraparib (2 μM), valproate (250 μM) or the drugs in combination for 4h and 8h. At each time point the mean number of intense GFP+ and RFP+ punctae were determined in at least 40 cells in independent triplicate (n = 3 +/- SD). b. and c. Spiky cancer cells were transfected with a scrambled siRNA control (siSCR) or with validated siRNA molecules to knock down the expression of the indicated proteins. In parallel cells were also transfected with an empty vector plasmid (CMV) or with plasmids to express c-FLIP-s, BCL-XL or dominant negative caspase 9. Twenty-four h after transfection cells were treated with vehicle control or with [niraparib (2 μM) + valproate (250 μM)] in combination for 24h. Cells were isolated and viability determined by trypan blue exclusion (n = 3 +/- SD). d. Spiky cancer cells were treated with vehicle control, niraparib (2 μM), valproate (250 μM) or the drugs in combination, as indicated for up to 6h. At each indicated time point, cells were fixed in place and not permeabilized. Immunostaining was performed to detect the cell surface levels of the death receptor CD95 (n = 3 +/- SD).](/cms/asset/9f216d38-9916-4490-abea-b309dacc7d3b/kcbt_a_1472190_f0009_oc.jpg)
Figure 10. Niraparib suppresses the growth of BT474 mammary tumors. a. BT474 cells (2 × 10⁶) were implanted into the 4th mammary fat pad of athymic mice. Tumors permitted to form until the mean tumor volume was ~ 25 mm3. Animals were then segregated into groups with near identical mean volumes and the animals then treated for five days with the indicated therapeutic agents: vehicle control (cremophore) or niraparib 25 mg/kg (QD Days 1–5). Tumor volumes were measured prior to drug administration and every three days after the initiation of therapeutic interventions. (n = 10 mice per group +/-SEM). For BT474 cells when the volume of the tumor reached > 500 mm3, animals were humanely sacrificed and the tumor and blood removed for further studies. b.-c. Multiplex assays were performed using a Bio-Rad MAGPIX machine. Serum/tumor material was obtained at Day 8 (D8) or at termination of the study (T). Plasma was obtained from three separate animals and assayed in duplicate (n = 6 determinations +/- SEM). # p < 0.05 greater than value in vehicle control treated mice; * p < 0.05 less than value in vehicle control treated mice; ¶ p < 0.05 greater than corresponding value at Day 8; ¶¶ p < 0.05 less than corresponding value at Day 8.
Figure 11. Multiplex analyses of plasma from niraparib treated mice. A. and B. Multiplex assays were performed using a Bio-Rad MAGPIX machine. Plasma was obtained at Day 8 (D8) or at termination of the study (T). Material was obtained from three separate animals and assayed in duplicate for changes in protein phosphorylation (n = 6 determinations +/- SEM). # p < 0.05 greater than value in vehicle control treated mice; * p < 0.05 less than value in vehicle control treated mice; ¶ p < 0.05 greater than D8 value.
Figure 12. Multiplex analyses of plasma and tumor tissues from niraparib-treated mice. Multiplex assays were performed using a Bio-Rad MAGPIX machine. Plasma and tumor material was obtained at Day 8 (D8) or at termination of the study (T). Material was obtained from three separate animals and assayed in duplicate for changes in protein phosphorylation (n = 6 determinations +/- SEM). # p < 0.05 greater than value in vehicle control treated mice; * p < 0.05 less than value in vehicle control treated mice; ¶ p < 0.05 greater than D8 value.
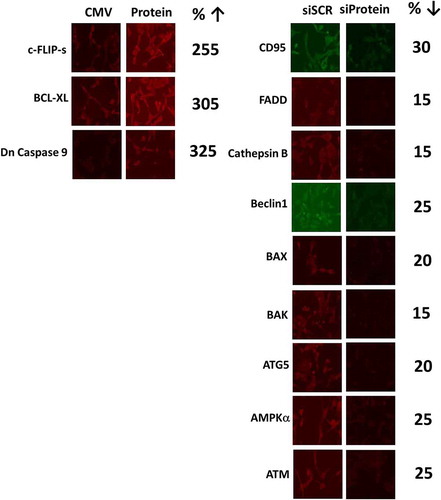
Figure 13. Control studies demonstrating the knock down and over-expression of proteins, manipulated in the present studies. The percentage of protein remaining after knock-down is presented. The percentage increase of the expressed protein is presented.