
Figures & data
Table 1. IC50 and RI of cell lines CNE1, CNE2, CNE1DDP, and CNE2DDP for different drugs.
Figure 1. Growth curve and colony survival of the four cell lines. (A) Growth curves of CNE1 and CNE1DDP (left) and of CNE2 and CNE2DDP (right) are shown. The chemoresistant cell lines grew evidently more slowly than CNE1 and CNE2 from the second day onwards. The experiments were done in triplicate. Points, mean; bars, S.D.; *, p < 0.05 of chemoresistant vs. parent cell lines by student’s t test. (B) Colony survival assays as described in methods. Colonies were stained with crystal violet and photographed. (C) Plate colony curves showing that the chemoresistant cell lines had higher clonogenic survival rates than the parental cell lines. Data are presented as mean ± SD (*p < 0.05; Student’s t test).
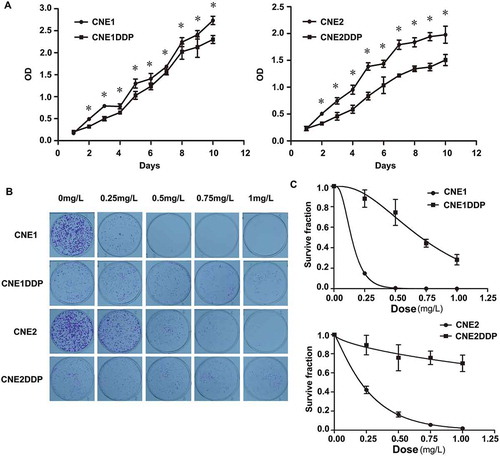
Table 2. Summary of peptide identification in three technical replicates.
Figure 2. MS/MS spectra used for identification and quantitation of ANXA1, STMN1, and TALDO1 in CNE1DDP vs. CNE1 and CNE2DDP vs. CNE2. (A) Top, the sequence AAYLQETGKPLDETLK allows the identification of ANXA1 (left), and the iTRAQ reporter ions released provide the relative quantitation of ANXA1 in the four cell lines evaluated (right). Middle, the sequence DLSLEEIQK allows the identification of STMN1 (left), and the iTRAQ reporter ions released provide the relative quantitation of STMN1 in the four cell lines evaluated (right). Bottom, the sequence AAQASDLEK allows the identification of TALDO1 (left), and the iTRAQ reporter ions released provide the relative quantitation of TALDO1 in the two cell lines evaluated (right). Cell lines CNE1 and CNE2 were labeled with iTRAQ reagents 113 and 116, respectively; cell line CNE1DDP was labeled twice with iTRAQ reagents 114 and 119; cell line CNE2DDP was labeled twice with iTRAQ reagents 117 and 121. (B) mRNA expressional levels of the three genes, which were consistent with the MS analysis of the corresponding proteins. Histogram shows the relative gene expression levels in chemoresistant compared to parent cell lines. Bars represent means ± SD; p < 0.05 as determined using Student’s t test.(C) A representative western blotting showing ANXA1 protein levels in cell lines CNE1 and CNE1DDP,CNE2 and CNE2DDP (left); histogram shows the ANXA1 expression levels in the four cell lines as determined by densitometric analysis (right). GAPDH was used as the internal loading control. Bars represent means ± SD; *p < 0.05, as determined using Student’s t test.
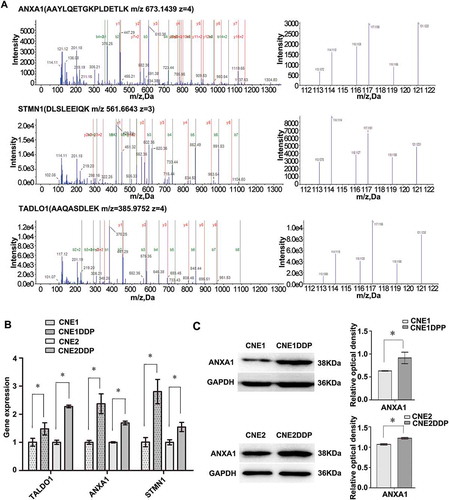
Figure 3. MS/MS spectra used for identification and quantitation of HSPA8, PRDX1, RCN1, and HSPB1 in CNE1DDP vs. CNE1. (A) Top, the sequence DAGTIAGLNVLR allows the identification of HSPA8 (left), and the iTRAQ reporter ions released provide the relative quantitation of HSPA8 in the two cell lines evaluated (right). Upper middle, the sequence ADEGISF allows the identification of PRDX1 (left), and the iTRAQ reporter ions released provide the relative quantitation of PRDX1 in the two cell lines evaluated (right). Lower middle, the sequence AADLNGDLTATR allows the identification of RCN1 (left), and the iTRAQ reporter ions released provide the relative quantitation of RCN1 in the two cell lines evaluated (right). Bottom, the sequence AQLGGPEAAK allows the identification of HSPB1 (left), and the iTRAQ reporter ions released provide the relative quantitation of HSPB1 in the two cell lines evaluated (right). Cell line CNE1 was labeled with iTRAQ reagent 113, and cell line CNE1DDP labeled twice with iTRAQ reagents 114 and 119. (B) mRNA expressional levels of the four genes, which were consistent with the MS analysis of the corresponding proteins. Histogram shows the relative gene expression levels in cell line CNE1DDP compared to those of cell line CNE1. Bars represent means ± SD; p < 0.05, as determined using Student’s t test.
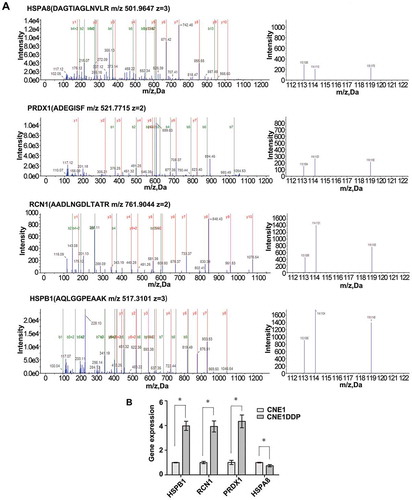
Figure 4. MS/MS spectra used for identification and quantitation of CALD1, PGD, RRM2, SFN, and TRIM29 in CNE2DDP vs. CNE2. (A) Top, the sequence EAEPQVEAGK allows the identification of CALD1 (left), and the iTRAQ reporter ions released provide the relative quantitation of CALD1 in the two cell lines evaluated (right). Upper middle, the sequence AGQAVDDFIEK allows the identification of PGD (left), and the iTRAQ reporter ions released provide the relative quantitation of PGD in the two cell lines evaluated (right). Middle, the sequence AAAPGVEDEPLLR allows the identification of RRM2 (left), and the iTRAQ reporter ions released provide the relative quantitation of RRM2 in the two cell lines evaluated (right). Lower middle, the sequence EAGDAESR allows the identification of SFN (left), and the iTRAQ reporter ions released provide the relative quantitation of SFN in the two cell lines evaluated (right). Bottom, the sequence EQDAVDQVK allows the identification of TRIM29 (left), and the iTRAQ reporter ions released provide the relative quantitation of TRIM29 in the two cell lines evaluated (right). Cell line CNE2 was labeled with iTRAQ reagent 116, and cell line CNE2DDP was labeled twice with iTRAQ reagents 117 and 121. (B) mRNA expressional levels of the five genes, which were consistent with the MS analysis of the corresponding proteins. Histogram shows the relative gene expression levels in cell line CNE2DDP compared to those of cell line CNE2. Bars represent means ± SD; p < 0.05, Student’s t test. (C) A representative western blotting showing TRIM29 protein levels in cell lines CNE2 and CNE2DDP (left); histogram shows the TRIM29 expression levels in the two cell lines as determined by densitometric analysis (right). β-Actin was used as the internal loading control. Bars represent means ± SD; *p < 0.05, as determined using Student’s t test.
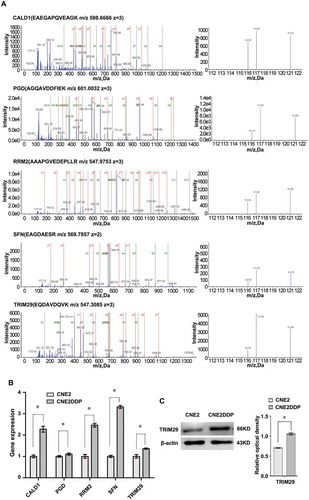
Figure 5. Bioinformatic analysis of 56 differentially expressed proteins in chemoresistant cell lines. (A) Left, Gene Ontology (GO) analysis of 56 differentially expressed proteins separated in molecular function, biological process, and cellular component. Right, proteins further divided into particular GO categories are shown. The pie chart area is proportional to each GO category. (B) Bar chart of KEGG pathway analysis with a filter of – log(P-value)> 2 showing differentially expressed proteins significantly enriched in several signaling pathways. (C) Predicted miRNAs from the differentially expressed genes. Columns represent different genes, and bars represent the number of miRNAs. (D) Protein-protein interaction networks of differentially expressed proteins. Each node represents all the proteins produced by a single, protein-coding gene locus. Large nodes indicate that some 3D structure is known or predicted, and small nodes indicate proteins with unknown 3D structure. Colored nodes correspond to query proteins and the first shell of interactors, and white nodes correspond to the second shell of interactors. Edges represent protein-protein associations. Associations indicate proteins that jointly contribute to a shared function, not necessarily that they are physically bound to each other. Linked lines represent edge confidence: thicker lines indicate higher confidence.
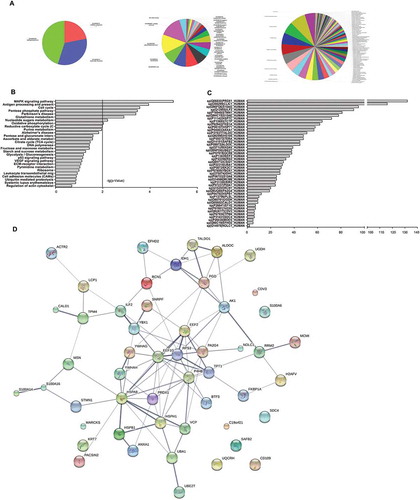
Table 3. IC50 of cell lines CNE1-ANXA1-OE and CNE2-ANXA1-OE for CDDP.
Table 4. IC50 of cell lines CNE1DDP-ANXA1-KD and CNE2DDP-ANXA1-KD for CDDP.
Figure 6. Effects of ANXA1 and TRIM29 on nasopharyngeal carcinoma cells. (A) Representative western blotting showing ANXA1 protein levels in cell lines CNE1, CNE2, CNE1DDP, CNE2DDP and the corresponding transfected cells. GAPDH was used as an internal control for loading(left). Histogram showing ANXA1 expression levels in the cell lines as determined by densitometric analysis(right). Bars represent means ± SD; *p < 0.05, as determined using One-way ANOVA analysis and SNK-q test. (B) Representative western blotting showing TRIM29 protein levels in cell lines CNE2, CNE2DDP, and the corresponding transfected cells. GAPDH was used as an internal control for loading(left). Histogram showing TRIM29 expression levels in the cell lines as determined by densitometric analysis(right). Bars represent means ± SD; *p < 0.05, as determined using One-way ANOVA analysis and SNK-q test.
Table 5. IC50 of cell lines CNE2-TRIM29-OE and CNE2DDP-TRIM29-KD for CDDP.