Figures & data
Figure 1. Validation of MET expression in cell lines and effect of MGCD516 in NSCLC and mesothelioma cells. A. Expression level of MET in NSCLC cell lines (A549, H1993) and lung epithelial cell line BEAS-2B were determined by immunoblotting. B. A549, H1993 and BEAS-2B were treated with increasing concentrations of MGCD516 for 72 hours. C. Expression level of MET in MPM cell lines (H2373, H2461) and mesothelioma control cell line MeT-5A were determined by immunoblotting. D. H2373, H2461 and MeT5A cell lines were treated with increasing concentrations of MGCD516 for 72 hours.
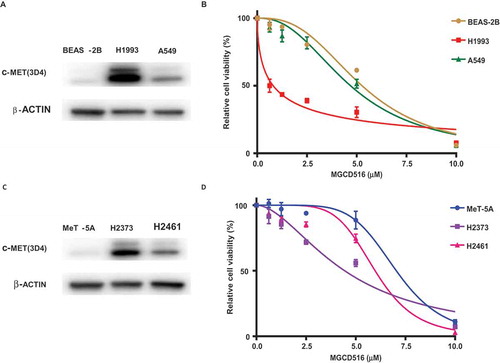
Figure 2. MGCD516 attenuates wound healing and invasion in NSCLC and MPM cells. A. DMSO or drug pretreated cells were seeded on 8W1E arrays as confluent monolayer. Cell monolayer was electrically wounded at 3.5 V for 30 sec for each well. Impedance and resistance of the cell layer were immediately recorded for a period of 25-40h. The wound was then allowed to heal from cells surrounding the small active electrode that did not undergo the elevated voltage pulse. MGCD516 treatment delayed wound healing compare to DMSO control for H1993 cells. b. MGCD516 treatment showed delay of wound healing compare to DMSO control for H2373 cells. c&e. Cells were treated with 2μM MGCD516 for 24 h and assayed as described in material and methods. Representative images show cells that penetrated Matrigel with or without MGCD516 treatment. d&f. Invasive cells were counted and analyzed by Prism software. Error bars indicate standard error of the mean. *p < 0.05, **p < 0.01, ***p < 0.001.
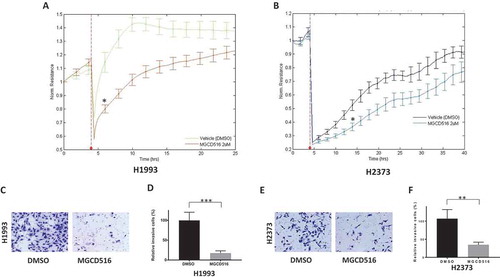
Figure 3. MGCD516 inhibits DRP1 activation and regulates mitochondrial morphology. a&d. MGCD516 inhibited HGF induced activation of DRP1 (phosphorylation at Ser616) in H1993 and H2373 cells. The cells were treated with 2µM of MGCD516 or DMSO for 24 hours, followed by stimulation with 100 ng/ml HGF for 15 min. Treated cells were then analyzed by Western blot. b&e. Changes of mitochondrial morphology in cells treated with MGCD516 or DMSO. Representative images of one H1993 and one H2373 cell either treated with DMSO or MGCD516 are shown. Inlets represent an enlarged part of the cells to show details of mitochondrial morphology. c&f. Quantification of mitochondrial lengths. Length of a single mitochondrion was defined from either one end to the next branching point or from one branching point to another. Measurements were carried out using ImageJ software. The numbers showed the averages of at least 20 measurements per cell from 50 cells. Data analysis were carried out by Prism software. Error bars indicate standard error of the mean. *p < 0.05, **p < 0.01, ***p < 0.001.
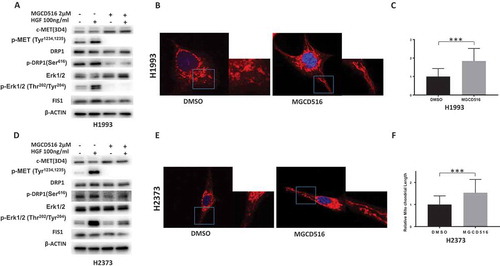
Figure 4. MET regulates DRP1 activation and mitochondrial morphology. a&d. Knockdown of MET downregulated activated DRP1 in H1993 and H2373 cells. b&e. Knockdown of MET induces elongated mitochondria in H1993 and H2373 cells. Inlets represent an enlarged part of the cells to show details of mitochondrial morphology. c&f. Quantification of mitochondrial lengths. The numbers showed the averages of at least 20 measurements per cell from 50 cells. Data analysis were carried out by Prism software. Error bars indicate standard error of the mean. *p < 0.05, **p < 0.01, ***p < 0.001.
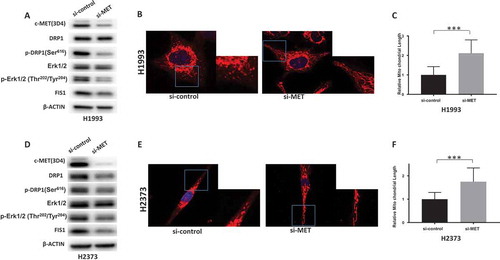
Figure 5. MGCD516 treatment results in significant tumor growth inhibition in vivo models.a. Tumor growth curve of H1993 xenograft. H1993 xenograft was treated with MGCD516 20mg/kg or vehicle for 25 days after tumor volume reached an average of 200 to 300 mm3. b. Activation of MET and DRP1 were evaluated by IHC staining.
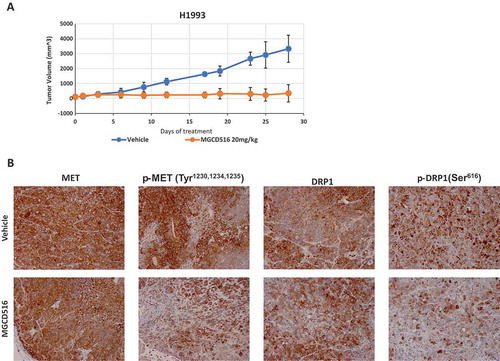
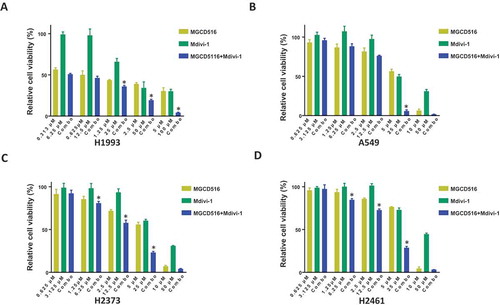
Figure 6. Combination of MGCD516 and Mdivi-1 showed higher efficacy than either drug alone in NSCLC and MPM. a to d. NSCLC cells (H1993 and A549) and MPM cells (H2373 and H2461) were treated with indicated concentrations for 72h. Data analysis were carried out by Prism software. Error bars indicate standard error of the mean. *p < 0.05.