Figures & data
Table 1. Primers sequences.
Table 2. MEG3 expressions in clinical samples.
Figure 1. MEG3 was low expressed in bladder urothelial carcinoma. (A) R package showed the differentially expressed lncRNAs in bladder urothelial carcinoma after analyzing lncRNAs expression profiles from 19 paired tissues of TCGA; (B) Heat map. R package showed the expression of the differentially expressed lncRNAs. MEG3 was one of the down-regulated lncRNAs; (C) RT-qPCR demonstrated that MEG3 was low expressed in bladder urothelial carcinoma tissues after comparing 45 tumor tissues with 45 adjacent tissues; (D) RT-qPCR demonstrated that MEG3 expression level in high-grade bladder urothelial cancer was lower than that in low-grade bladder urothelial cancer after comparing 29 high-grade cancer tissues with 16 low-grade cancer tissues; (E) RT-qPCR revealed that MEG3 production in muscular invasive bladder cancer was lower than that in non-muscle invasive bladder cancer after comparing 20 muscular invasive cancer tissues with 25 non-muscle invasive cancer tissues; (F) RT-qPCR showed that MEG3 expression in metastatic bladder cancer was lower than that in non-metastasis bladder cancer after comparing 10 metastatic cancer tissues with 35 non-metastasis cancer tissues; (G) RT-qPCR showed the expression of MEG3 in different BC cell line and normal cell line. *P < 0.05, **P < 0.01, compared with adjacent tissues, low grade bladder urothelial cancer, non-invasive bladder cancer or non-metastasis bladder cancer. Each RT-qPCR was repeated three times.
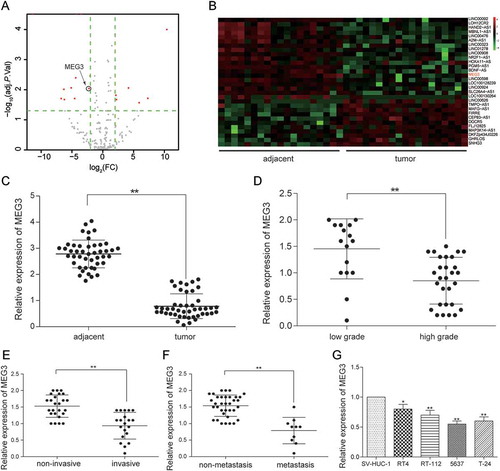
Figure 2. MEG3 up-regulation suppressed cell proliferation and enhanced cell apoptosis. (A) RT-qPCR showed that pcDNA3.1-MEG3 had high transfection efficiency in 5637 cells and T-24 cells; (B) MTT assay demonstrated that pcDNA3.1-MEG3 could slow down cell proliferation in 5637 cells and T-24 cells; (C) Flow cytometry revealed that cell apoptosis of cells transfected with pcDNA3.1-MEG3 was high in 5637 cells and T-24 cells; (D) Flow cytometry showed that pcDNA3.1-MEG3 blocked cells in G0/G1 phase in 5637 cells and T-24 cells. *P < 0.05, **P < 0.01, compared with pcDNA3.1-NC. Each test was repeated three times.
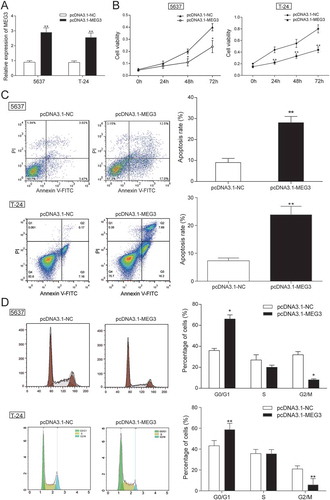
Figure 3. MEG3 up-regulation suppressed cell apoptosis related protein expression in 5637 cells and T-24 cells. (A-B) After being transfected with pcDNA3.1-MEG3, mRNA and protein expression level of apoptosis related protein Bcl-2 and Cyclin D1 was decreased, while the mRNA or protein expression of Bax, cleaved-caspase 3 were both increased after being examined by RT-qPCR and western blot. *P < 0.05, **P < 0.01, compared with pcDNA3.1-NC. Each test was repeated three times.
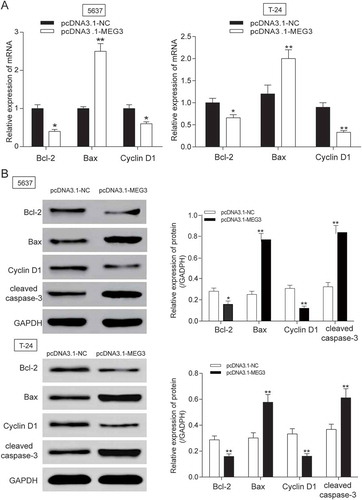
Table 3. MiR-96 expressions in clinical samples.
Figure 4. MiR-96 was highly expressed in bladder urothelial carcinoma. (A)Volcano plot, R package was used to analyze the miRNAs expressed differentially in bladder urothelial carcinoma after analyzing miRNAs expression profiles from 19 paired tissues of TCGA; (B) Heat map. R package showed the expression of the differentially expressed lncRNAs. MiR-96 was one of the intensely expressed miRNAs; (C) RT-qPCR demonstrated that miR-96 was up-regulated in bladder urothelial carcinoma tissues after comparing 45 tumor tissues with 45 adjacent tissues; (D) RT-qPCR revealed that miR-96 expression level in 29 high-grade bladder urothelial cancer tissues was higher than that in 16 low-grade bladder urothelial cancer tissues; (E) RT-qPCR showed that miR-96 production in 20 muscular invasive bladder cancer tissues was higher than that in 25 non-muscle invasive bladder cancer tissues; (F) RT-qPCR demonstrated that miR-96 expression in 10 metastatic bladder cancer tissues was higher than that in 35 non-metastasis bladder cancer tissues; (G) RT-qPCR showed the expression of MEG3 in different BC cell line and normal cell line. *P < 0.05, **P < 0.01, compared with adjacent tissues, low grade bladder urothelial cancer, non-invasive bladder cancer or non-metastasis bladder cancer. Each RT-qPCR was repeated three times.
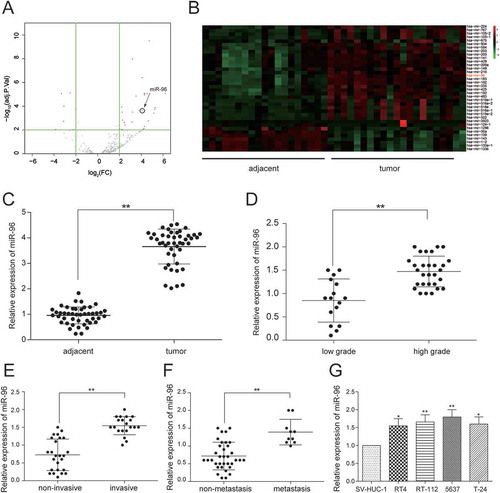
Figure 5. MiR-96 was a target of MEG3 in 5637 cells and T-24 cells. (A) RT-qPCR showed that MEG3 and miR-96 expression in 45 paired tissues and revealed that MEG3 and miR-96 were negatively related; (B) MiRcode predicted that MEG3 and miR-96 might have a binding site; (C) Dual luciferase reporter assay proved that MEG3 bound to miR-96 directly. The group which binding site on MEG3 was mutated (mut group) had no significant difference after being treated with miR-96 mimics; (D) RT-qPCR demonstrated that pcDNA3.1-MEG3 could suppress the expression of miR-96; (E) RT-qPCR showed that miR-96 mimics could not affect the production of MEG3. *P < 0.05, **P < 0.01, compared with NC. Each test was repeated three times.
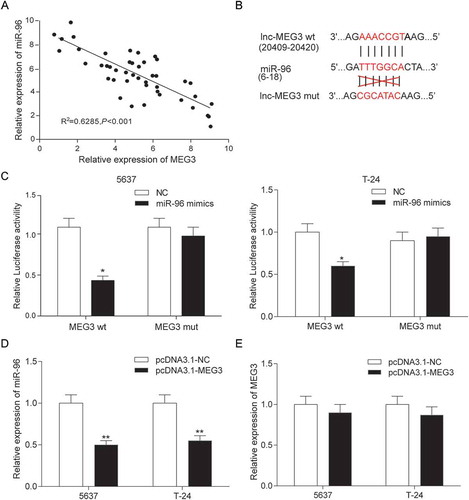
Figure 6. MEG3 inhibited cell proliferation and enhanced cell apoptosis by targeting miR-96 in 5637 cells and T-24 cells. (A) RT-qPCR showed that miR-96 mimics and miR-96 inhibitor had high transfection efficiency in 5637 cells; (B) MTT assay demonstrated that cell proliferation of cells transfected with pcDNA3.1-MEG3 or miR-96 inhibitor was slowed down, while cell proliferation of cells transfected with miR-96 mimics was accelerated. PcDNA3.1-MEG3+ miR-96 mimics group had no remarkable difference with NC group; (C) Flow cytometry revealed that pcDNA3.1-MEG3 and miR-96 inhibitor could promote cell apoptosis, whereas miR-96 mimics inhibited it. NC group also had no remarkable difference compared with pcDNA3.1-MEG3+ miR-96 mimics group. *P < 0.05, **P < 0.01, compared with NC. Each test was repeated three times.
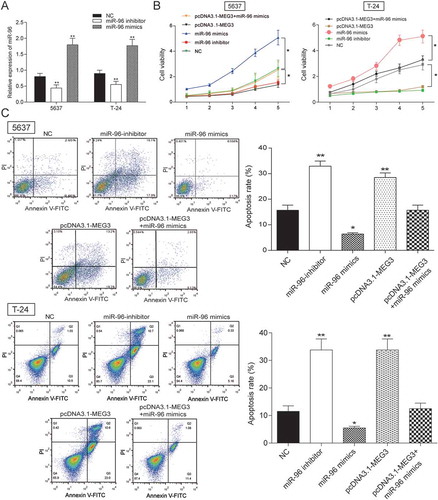
Figure 7. MEG3 inhibited cell proliferation and enhanced cell cycle by targeting miR-96 in 5637 cells and T-24 cells. Flow cytometry revealed that cells transfected with pcDNA3.1-MEG3 or miR-96 inhibitor were blocked in G0/G1 phase. But miR-96 mimics had the opposite effect. *P < 0.05, compared with NC. Each test was repeated three times.
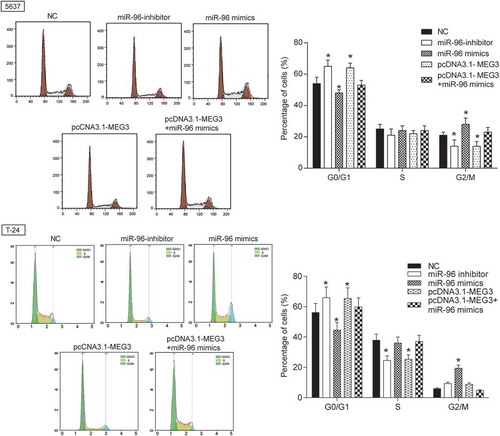
Table 4. TPM1 expressions in clinical samples.
Figure 8. TPM1 was down-regulated in bladder urothelial carcinoma. (A) Volcano plot, R package was used to analyze genes expressed differentially in bladder urothelial carcinoma after analyzing miRNAs expression profiles from 18 paired tissues of TCGA; (B) Heat map. R package showed the expression of the differentially expressed mRNAs. TPM1 was one of the low expressed genes. (C) RT-qPCR demonstrated that TPM1 was low expressed in bladder urothelial carcinoma tissues after comparing 45 tumor tissues with 45 adjacent tissues; (D) RT-qPCR revealed that TPM1 expression in 29 high-grade bladder urothelial cancer tissues was lower than that in 16 low-grade bladder urothelial cancer tissues; (E) RT-qPCR demonstrated that TPM1 production in 20 muscular invasive bladder cancer tissues was lower than that in 25 non-muscle invasive bladder cancer tissues; (F) RT-qPCR showed that TPM1 expression in 10 metastatic bladder cancer tissues was lower than that in 35 non-metastasis bladder cancer tissues; (G) RT-qPCR showed the expression of TPM1 in different BC cell line and normal cell line. **P < 0.01, compared with adjacent tissues, low grade bladder urothelial cancer, non-invasive bladder cancer or non-metastasis bladder cancer. Each RT-qPCR was repeated three times.
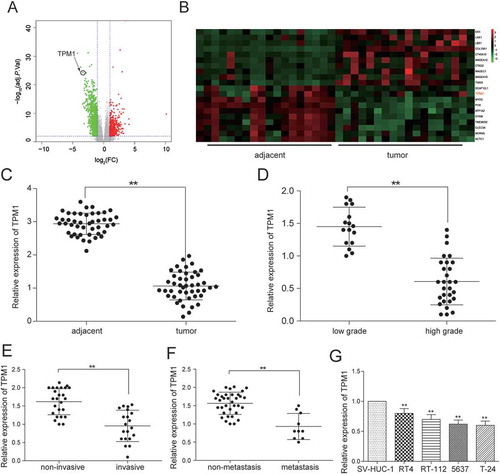
Figure 9. TPM1 was a target gene of MiR-96 in 5637 cells and T-24 cells. (A) RT-qPCR showed that miR-96 and TPM1 expression in 45 paired tissues and revealed that miR-96 and TPM1 were negatively related with TPM1; (B) MiRBase predicted that TPM1 and miR-96 might have a binding site; (C) Dual luciferase reporter assay proved the direct target relationship. The group which binding site on TPM1 (mut group) was mutated had no significant difference after being treated with miR-96 mimics; (D) RT-qPCR showed that miR-96 mimics could down-regulate the expression of TPM1; (E) RT-qPCR demonstrated that pcDNA3.1-TPM1 could not down-regulate the production of miR-96; (F) Western blot revealed that PcDNA3.1-TPM1 group had high expressed TPM1 and miR-96 mimics group had low expressed TPM1. PcDNA3.1-TPM1+ miR-96 mimics had no significant change compared with NC group. *P < 0.05, **P < 0.01, compared with NC. Each test was repeated three times.
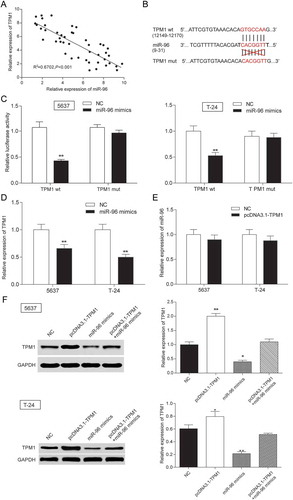
Figure 10. TPM1 inhibited cell proliferation and promoted cell apoptosis in 5637 cells and T-24 cells. (A) RT-qPCR showed that miR-96 mimics, pcDNA3.1-TPM1 and pcDNA3.1-TPM1+ miR-96 mimics had high transfection efficiency in 5637 cells; (B) MTT assay demonstrated that cell proliferation in pcDNA3.1-TPM1 group was inhibited, while cell proliferation in miR-96 mimics group was accelerated. PcDNA3.1-MEG3+ miR-96 mimics group had no remarkable difference compared with NC group; (C) Flow cytometry revealed that pcDNA3.1-TPM1 could promote cell apoptosis, whereas miR-96 mimics inhibited it. PcDNA3.1-MEG3+ miR-96 mimics group had no remarkable difference compared with NC group; (D) Flow cytometry showed that cells transfected with pcDNA3.1-TPM1 were blocked in G0/G1 phase. But miR-96 mimics had the opposite effect. *P < 0.05, **P < 0.01, compared with NC. Each test was repeated three times.
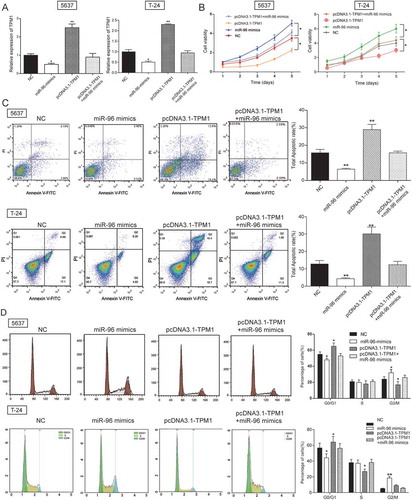
Figure 11. MEG3 and miR-96 suppression inhibited tumor growth by targeting TPM1 in vivo. (A) After injecting with pcDNA3.1-MEG3 or miR-96 inhibitor, tumor growths were decreased remarkably in vivo; (B) Tumor volumes were examined. It was found out that tumor volume in pcDNA3.1-MEG3 group and miR-96 inhibitor group were smaller than in NC group; (C) Tumor weights were tested. It was found out that tumor weight in pcDNA3.1-MEG3 group and miR-96 inhibitor group were also lighter than in NC group; (D) Western blot showed that pcDNA3.1-MEG3 and miR-96 inhibitor could both up-regulated the expression of TPM1. **P < 0.01, compared with pcDNA3.1-NC or miR-96 mimics-NC. Each test was repeated three times.
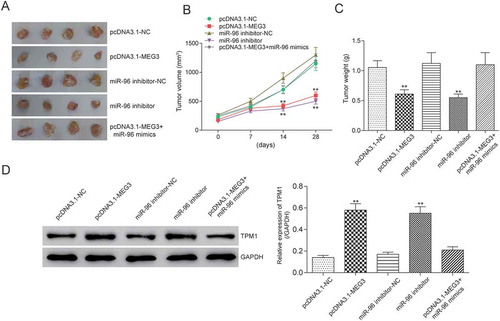
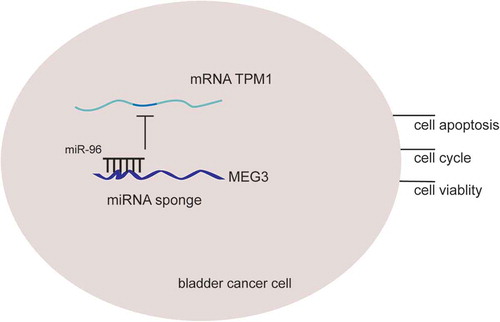
Figure 12. The rationale of MEG3, miR-96 and TPM1. LncRNA MEG3 can serve as natural miRNA sponges by competitive binding to miR-96 to suppress its expression as well as function, then further up-regulate TPM1 expression and consequently inhibits bladder cancer progression.