Figures & data
Figure 1. LPS promotes the invasion of HCC via upregulating caspase-1(A,B) Western blot analysis indicates that LPS induces EMT process and caspase-1 expression. HepG2 and HCCLM3 cells were incubated with 0, 5, 10 µg/ml LPS for 24 h. Protein levels of E-cadherin, Vimentin and caspae-1 were analyzed by western blot and normalized to GAPDH. (C-D) Western blot analysis indicates that caspase-1 is essential for LPS induced EMT process. HepG2 and HCCLM3 cells were incubated with 10ug/ml LPS for 24 h. Protein levels of E-cadherin, Vimentin and caspae-1 were analyzed by western blot and normalized to GAPDH. (E) Invasion experiments were determined by transwell assays and number of invaded cells was counted. Data are means ± SEM from 3 independent experiments, * means p < 0.05, ** means p < 0.01, *** means p < 0.001 by unpaired student T test.
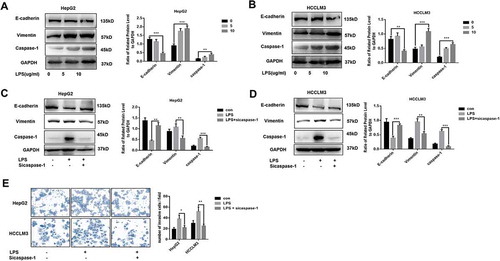
Figure 2. Sorafenib decreases caspase-1 expression and represses LPS-stimulated caspase-1 expression through restricting p65 nuclear translocation (A) Western blot analysis indicates that sorafenib decreases caspase-1 in a dose-dependent way. HCCLM3 cells were incubated with 0, 0.5, 1, 5, 10, 20 µm sorafeniib for 24 h. (B) Western blot analysis indicates that sorafenib decreases caspase-1. HepG2 and HCCLM3 cells were incubated with 10 um sorafeniib for 24 h. Protein levels of caspase-1 were analyzed by western blot and normalized to GAPDH. (C) Western blot analysis indicates that sorafenib restricts the nuclear transport of p65. Nuclear protein levels of p65 were analyzed by western blot and normalized to Histone H1. (D,E) Western blot analysis indicates that sorafenib suppresses the nuclear transport of p65 caused by LPS. Nuclear protein levels of p65 were analyzed by western blot and normalized to Histone H1. (F) Representative images show the distribution of p65 was visualized by performing immunofluorescence experiments. Scale bars = 20 µm. (G) q-PCR analysis indicates that sorafenib decreases caspase-1 expression and represses LPS-induced caspase-1 overexpression. (H) Caspase-1 enzymatic activity was measured by caspase-1 activity assays. Data are means ± SEM from 3 independent experiments, * means p < 0.05, ** means p < 0.01, *** means p < 0.001 by unpaired student T test.
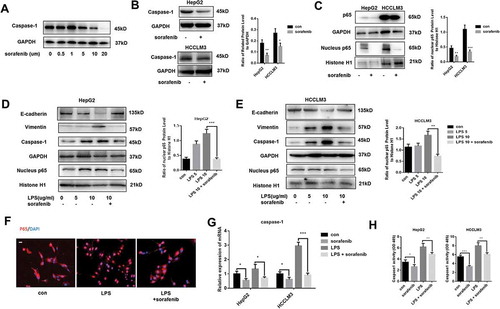
Figure 3. Sorafenib inhibits SUMO1 mediated SUMOylation of p65(A) Western blot analysis indicates that sorafenib decreases SUMO1. HepG2 and HCCLM3 cells were incubated with 10 µm sorafenib for 24h. Protein levels of SUMO1 were analyzed by western blot and normalized to GAPDH. (B) Co-immunoprecipitation experiments indicate sorafenib inhibits the interaction of p65 and SUMO1. (C) Immunofluorescences staining p65 and SUMO1 were performed. Data are means ± SEM from 3 independent experiments, * means p < 0.05, ** means p < 0.01, *** means p < 0.001 by unpaired student T test.
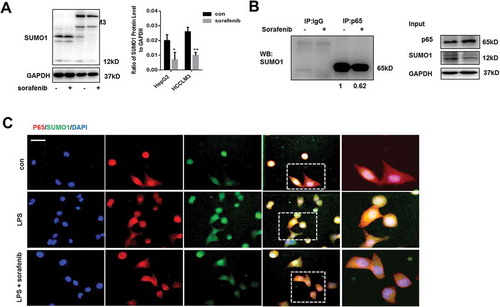
Figure 4. LPS-induced caspase-1 overexpression was by activating TLR4/stat3/SUMO1 signaling pathway(A) Western blot analysis indicates that TLR4/stat3 signaling is essential for LPS-induced caspase-1 expression. LPS-treated HCCLM3 cells were cultured with or without 10 µm stattic for 24 h. (B) Immunofluorescence staining p65 and transwell experiments were performed. LPS-treated HepG2 and HCCLM3 cells were cultured with or without 10 µm stattic for 24 h. (C) Western blot analysis indicates that stat3 signaling is essential for LPS-induced EMT phenotype. (D) q-PCR analysis reveals that Stat3 activation is essential for LPS-induced caspase-1 overexpression. (E) Caspase-1 enzymatic activity was measured by caspase-1 activity assays. Data are means ± SEM from 3 independent experiments, * means p < 0.05, ** means p < 0.01, *** means p < 0.001 by unpaired student T test.
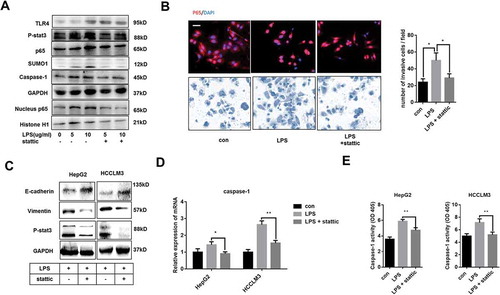
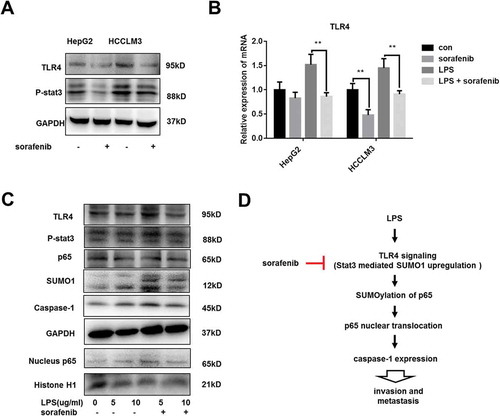
Figure 5. sorafenib inhibits LPS-mediated activation of TLR4/stat3/SUMO1 pathway (A) Western blot analysis indicates that TLR4/stat3 signaling was repressed by sorafenib. HepG2 and HCCLM3 cells were incubated with 10 µm sorafeniib for 24 h. (B) q-PCR analysis reveals that sorafenib decreases TLR4 expression and represses LPS-induced TLR4 overexpression. (C) Western blot analysis indicates that LPS-induced activation of TLR4/stat3 signaling is repressed by sorafenib. LPS-treated HCCLM3 cells were cultured with or without 10 µm sofanib for 24 h. (D) Schematic diagram. Sorafenib decreases caspase-1 expression and suppresses LPS-induced caspase-1 overexpression through inhibiting TLR4/stat3/SUMO1 signaling cascades. Data are means ± SEM from 3 independent experiments, * means p < 0.05, ** means p < 0.01, *** means p < 0.001 by unpaired student T test.