Figures & data
Figure 1. Endoscopy and CT scan. (a) Endoscopy feature capture showing the protruding lesion on the posterior wall of the gastric cardia, with an ulcer in the middle. (b) CT scan showing a non-homogeneously enhanced irregular mass in the gastric cardia, with suspected invasion to the spleen.
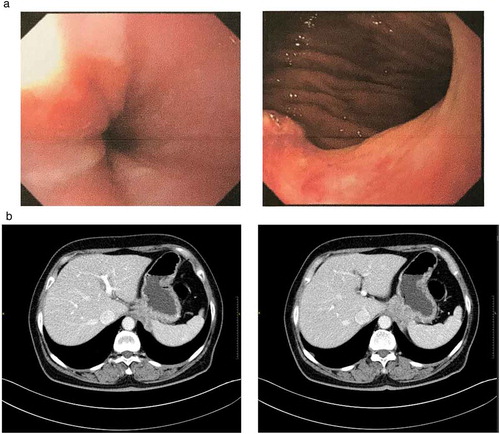
Figure 2. Copy number (CN) scatter diagram. The 520 oncogenic genes of the panel all have their own positions on the chromosome (horizontal axis). Every gene position corresponds to one capture domain, and every capture domain is cut into several continuous bins. The copy number (vertical axis) of every bin is examined and recorded as every spot in the diagram. The copy-number spots of key genes are highlighted in color. Each gene’s final copy number is calculated as the average of all its bin’s copy numbers.
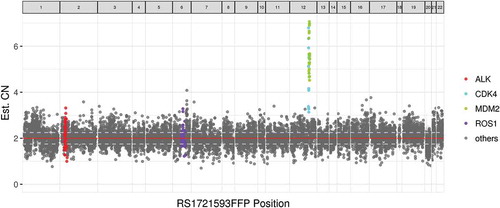
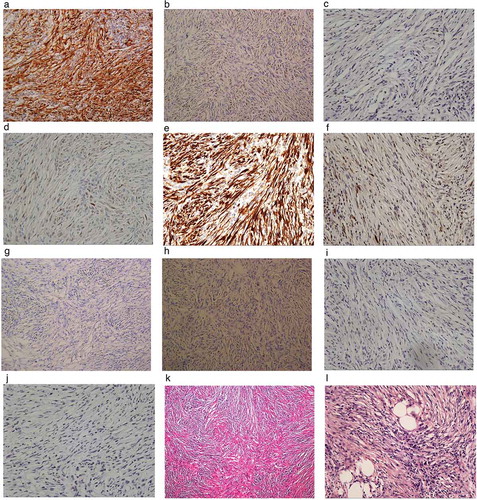
Figure 3. Histopathological and immunohistochemical appearance. (a) Positive immunostaining with monoclonal rabbit anti-human CDK4 (EP189, Zhongshan). (b) Positive immunostaining with monoclonal mouse anti-human MDM2 (SMP14, Thermo Fisher). (c) Negative immunostaining with monoclonal rabbit anti-human CDK2 (E304, Abcam). (d) Sporadically positive immunostaining with monoclonal cyclin D1 (EP12, Roche). (e) Diffusely positive immunostaining with p16ink4a (E6H4, Roche). (f) Sporadically positive immunostaining with polyclonal rabbit anti-human p19ink4d (Abcam). (g) Negative immunostaining with monoclonal mouse anti-human ALK (OTI1A4, Zhongshan). (h) Negative immunostaining with monoclonal mouse anti-human p53 (D0-7, Leica). (i) Negative immunostaining with monoclonal rabbit anti-human cyclin E1 (SP146, Abcam). (j) p21 WAF1 (DCS-60.2, Zhongshan Golden Bridge). (k) Low-power view showing the tumor to be mainly composed of spindle cells, collagen fibers, and inflammatory infiltration consisting of an increasing number of plasma cells and lymphocytes (H&E staining, × 10). (l) High-power view shows very little atypia and low-level mitosis (H&E staining, × 400).