Figures & data
Table 1. Relative expression levels of FOXD4 according to clinicopathological parameters.
Figure 1. FOXD4 was over-expressed in CRC and was associated with poor survival. (A-B) The expression of FOXD4 was examined by quantitative real-time PCR of colorectal cancer tissues and adjacent noncancerous tissues. (C-D) The expression of FOXD4 was examined by western blots derived from colorectal cancer tissues and adjacent noncancerous tissues. (E-F) The expression of FOXD4 as documented for CRC cohorts on TCGA and GEO databases. (F-G) The Kaplan-Meier method was used to analyze the overall survival and recurrence-free survival of patients based on their FOXD4 levels. (*p < 0.05, **p < 0.01, ***p < 0.001).
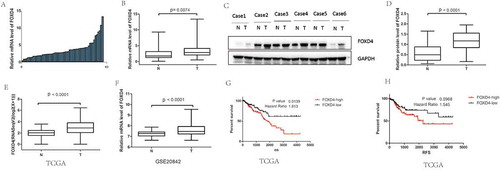
Figure 2. FOXD4 promoted cell invasion and migration ability in vitro. (A-B) FOXD4 knockdown by siRNA in LoVo cells was measured via quantitative real-time PCR and western blot. (C) Transwell assay revealed that knockdown of FOXD4 inhibited migration and invasion of LoVo cells. (D-E) FOXD4 up-regulation by pcDNA3.1- FOXD4 in SW480 cells were examined via quantitative real-time PCR and western blot. (F) Transwell assay was used to reveal that upregulation of FOXD4 promoted migration and invasion of SW480 cells. (G-H) FOXD4 knockdown by siRNA in SW620 cells was examined via quantitative real-time PCR and western blot. (I) Transwell assay was used to reveal that knockdown of FOXD4 inhibited migration and invasion of SW620 cells. (*p < 0.05, **p < 0.01, ***p < 0.001)
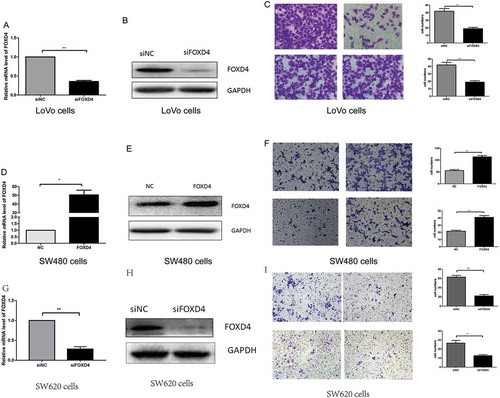
Figure 3. FOXD4 regulated EMT through SNAI3/CDH1. (A-D) The co-expression of FOXD4 and EMT markers was checked on TCGA database for their colorectal cancer cohort. (E-F) The expression of SNAI3 was examined via quantitative real-time PCR in LoVo cells transfected with siFOXD4 or control siRNA. (G-H) The expression of SNAI3 was examined via quantitative real-time -PCR in SW480 cells transfected with pcDNA3.1- FOXD4 or the control vector. (*p < 0.05, **p < 0.01, ***p < 0.001).
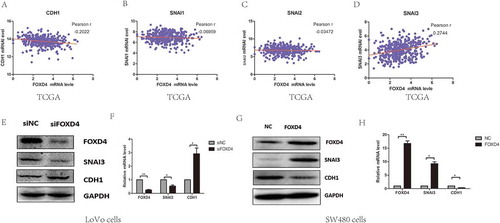
Figure 4. FOXD4 bounded to the promoter of SNAI3 and regulated SNAI3/Ecad expression. (A-B) Luciferase activity was measured after co-transfecting siFOXD4 or pcDNA3.1- FOXD4, and luciferase reporters containing the promoter region of SNAI3, into LoVo and SW480 cells. (C-E) The enrichment of FOXD4 on the promoter of SNAI3 was detected by ChIP assay of LoVo and SW480 cells transfected with siFOXD4 or pcDNA3.1- FOXD4. (F)The expression of CDH1 was measured by quantitative real-time PCR of LoVo cells co-transfected with pcDNA3.1- FOXD4 and siSNAI3. (*p < 0.05, **p < 0.01, ***p < 0.001).
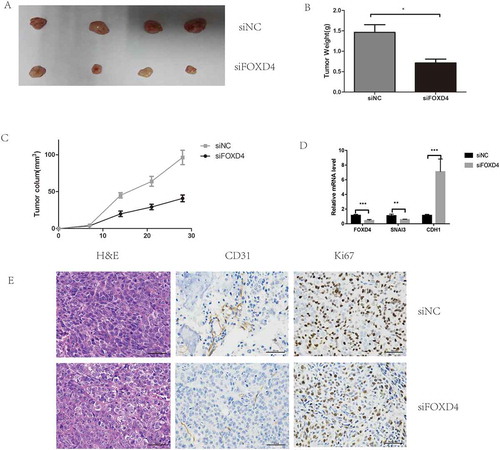
Figure 5. Silencing of FOXD4 inhibited colorectal cancer progression in vivo. (A) Photographs of tumors were obtained from nude mice. (B-C) Tumor weight and volume were examined after injection of colorectal cancer cells stably transfected with sh- FOXD4 or control. (D) Quantitative real-time PCR was used to measure the expression of FOXD4,SNAI3 and CDH1 in the tumors. (E) Immunohistochemical was used to measure the expression of CD31 andKi67.
(*p < 0.05, **p < 0.01, ***p < 0.001)