
Figures & data
Figure 1. Proliferation and Apoptosis of CTC and T cells in MCR. PoBMC CTC and T cells isolated from the portal blood of 27 patients by FACS and labeled with CSFE prior to addition to cultures with and without other cell isolates (MDSC, DC, Fibroblasts) from the same patient’s PoBMC sample. DC were primed with sonicated CTC antigens prior to addition to the MCR. MCR cultures were held for 16–60 hr at 37C 5%CO2 and then harvested for flow cytometric analysis of cell cycle, T cell (white bars) and CTC (grey shaded bars) (A) proliferation by CFSE fluorescence dilution and (B) apoptosis induction by Annexin V-PE binding and 7AAD intercalation. (A) Addition of immune cells to the CTC MCR cultures did not significantly alter the rate of CTC cell division. (B) CTC (gray shaded bars) were found to be resistant to apoptosis with ≤ 10% increase in cell death seen with addition of T cells (CTCT) with or without CTC primed DC (CTCDCT) or other immune cells (MDSC, DC, MFB) present. In contrast, T cells (white bars) from the portal blood were highly apoptotic and had only a moderate activation increase in proliferation seen when CTC primed DC and CTC were present in the culture (A). However, T cell proliferation was significantly decreased by the presence of MDSC in place of DC as antigen presenting cells (p = 0.0200, A). Columns represent mean of data set and error bars represent standard error from the mean. Multiple variable analyses were done using a one-way ANOVA with Bonferroni Pairwise comparisons and pairwise comparisons were due using Mann-Whitney U test.
Figure 2. T cell activation and anergy in MCR. PoBMC T cell populations isolated from 13 patients (5 PDAC, 2AA, 3 CC, 2 IPMN, 1 non-malignant pancreatitis) by FACS and added to cultures with and without other cell isolates (CTC, MDSC, DC) from the same patient’s PoBMC sample. DC were primed with sonicated CTC antigens prior to addition to the MCR. MCR cultures were held for 16–60 hr at 37C 5%CO2 and then harvested for flow cytometric analysis of CD3 + T cell CD25 surface expression as a biomarker for T cell activation and CTLA4 surface expression as a biomarker for T cell anergy. CTLA-4 expression was analyzed with or without concomitant CD25 expression (p < 0.001). T cell activation was not significantly improved by the presence of CTC or CTC-primed DC. Columns represent mean of data set and error bars represent standard error from the mean. Multiple variable analyses were done using a one-way ANOVA with Bonferroni Pairwise comparisons and pairwise comparisons were due using Mann-Whitney U test.
Figure 3. PDAC CTC are the most proliferative and most resistant to T cell cytotoxicity in MCR compared to other Peri-ampullary tumor types. Comparison of 23 patients’ CTC proliferation in culture alone (white bars) or in MCR with T cells (+T, hatched bars) indicated that T cells had little to no effect on CTC proliferation in any tumor type tested (PDAC (n = 7; 4 with pre-operative chemotherapy treatment (PDAC NEO), Ampullary (AA, n = 11), Cholangiocarcinoma (CC, n = 2), and intrapapillary mucinous neoplasm (IPMN, n = 3)). PDAC CTC proliferation was significantly greater than all other tumor types tested (p = 0.0301). Pre-operative chemotherapeutic treatment (PDAC NEO) of patients prior to surgery significantly decreased PDAC CTC proliferation with or without T cells present (p = 0.0019, p = 0.0191, respectively). Columns represent mean of data set (duplicate wells/sample whenever possible) and error bars represent standard error from the mean. Multiple variable analyses were done using a one-way ANOVA with Bonferroni Pairwise comparisons and pairwise comparisons were due using Mann-Whitney U test, as appropriate.
Figure 4. CTC cluster formation in PoBMC culture. A) CTC containing PoBMC samples were noted to spontaneously formed clusters containing CTC when held in rich media culture at about 7–11 days in vitro. PoBMC isolated from ficoll histopaque gradients were cultured in rich media alone (A,13 days), or in media supplemented with 50% Matrigel (B, 7 days), 10µg/ml human fibronectin (C, 7 days), 10µg/ml human adiponectin (D, 12 days), or 0.5 µg/ml MCSF (E, 7 days). Fibroblast-like cells (B, arrow) became apparent in the cultures in 3–5 days and multi-cell type clusters were visible by 7 days in culture in monolayer cultures (A-E). At 11days, cultures began to exhibit fibroblast ‘networking’ reminiscent of stroma development (D). No quantitative differences were found among the treatments in their ability to support CTC cluster formation. Images representative of cultures from 31 patients as micrographs taken on as DIC images on a Zeiss Axiovert fluorescence DIC microscope. Size bars represent 200 pixels (34,000 microns).
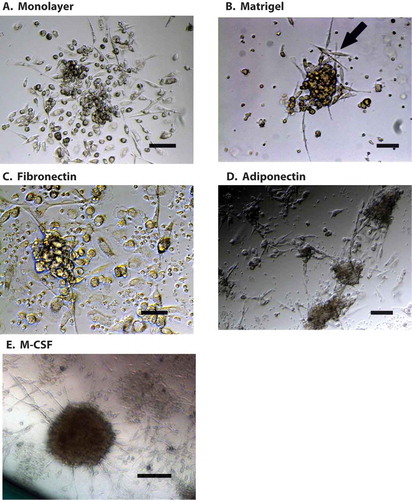
Figure 5. Portal blood CTC cluster formation promotes CTC proliferation in PDAC and cholangiocarcinoma. Flow cytometric analysis of 30 patients’ PoBMC (5 PDAC (2 with pre- operative (neo adjuvant) chemotherapy treatment (PDAC NEO), 15 AA, 4 CC, 6 IPMN) in CTC cluster cultures indicated that CTC proliferation was enhanced in PoBMC cluster cultures compare to the ex vivo input to the cultures (median counts listed in ). CTC proliferation in cluster cultures derived from patients with PDAC or CC was greater than PoBMC from patients with AA or IPMN (p values as indicated on the graph). Preoperative chemotherapy significantly decreased CTC proliferation in cluster cultures compared with PDAC patient without pre-operative treatment (p = 0.0485). No significant difference was seen between pancreatico-biliary cancer types and intestinal type ampullary adenocarcinomas in supporting CTC proliferation in CTC clusters in the portal blood (data not shown). Columns represent mean of data set and error bars represent standard error from the mean. Multiple variable analyses were done using a one-way ANOVA with Bonferroni pairwise comparisons and pairwise comparisons with Mann-Whitney U test, as appropriate.
Figure 6. FACS depleted PoBMC cultures indicate that CTC and CD105 + /CD14 + myeloid fibroblasts are essential to CTC cluster formation. One to five million PoBMC were cultured for 7 days in rich medium (A) without FACS sorting (G,H; POBMC, white bars) and after FACS depletion of (B) CD44 + CD147 + EPCAM + CD45- CTC population, (C) CD105 + total fibroblast populations, (E) CD3 + CD45 + T cell populations, and F) CD33 + CD11b + CD14 + CD11c-MHCDR- MDSC and CD11c + MHCDR + DC populations (G,H; gray bars). Only the depletion of CTC (-CTC, B) and CD105 + fibroblast populations eliminated cluster formation (-FB, C). Images in panels A-F represent 20x magnification micrographs taken on as DIC images on a Zeiss Axiovert fluorescence DIC microscope. Size bar represents 200 pixels (34,000 microns). Addition of the FACS selected CTC population restored cluster formation (D, H, hatched bars, +CTC) and allowed for survival and growth of CTC (G, hatched bars) within the cluster culture. Addition of CD105 + fibroblasts restored CTC growth in cluster cultures (G, hatched bars, -FB, +total FB). On further analysis of CD105 + subpopulations (H), addition of CD105+/CD14- fibroblasts (+FB) to the depleted PoBMC did not restore clustering; however, addition of CD105 + /CD14 + myeloid fibroblasts (+MFB) did. Bars on graphs (G,H) represent mean of data set and error bars represent standard error from the mean 7 days after ex vivo PoBMC culture. Mean input ex vivo CTC numbers for 7 runs of these studies was 4,425 ± 11,002 CTC per million PoBMC as determined by FACS isolated CTC analysis prior to culture. Statistical analyses yielding the significance values depicted on graphs of CTC growth (G) and cluster area (H) included one-way ANOVA multiple variant analysis with Bonferroni pairwise comparisons and pairwise comparisons with Mann-Whitney U test, as appropriate.
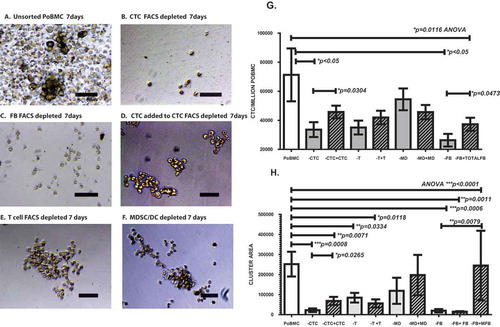
Table 1. Demographic information for study participants & median CD47 + CD147 + EPCAM + CD45- potential CTC/million cells isolated from ex vivo portal venous blood samples.