Figures & data
Figure 1. RNA-seq focused on circRNAs for the specimens of esophageal cancerous tissues and adjacent tissues. A. Dot graph of the differentially expressed circRNAs. B. Cluster graph of the differentially expressed circRNAs in up-regulated and down-regulated expression. C. Top 20 of the enriched pathways. D. GO analysis of the differentially expressed circRNAs.
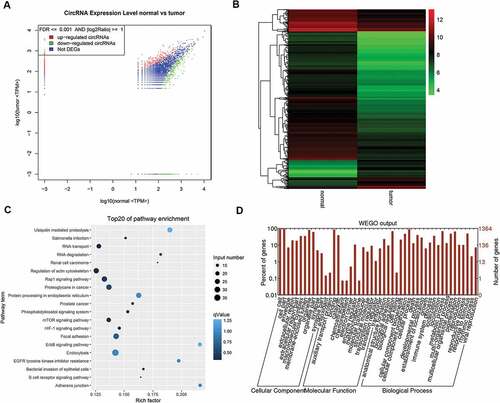
Figure 2. Validation of the expression of the circRNAs in 14 pairs of specimens. There were 5 circRNAs presented significant differentially expression. 13 pairs of the specimens presented consistent expression patterns among the total of 14 pairs of specimens.
Figure 3. RT-PCR to validate the performance of the overexpression of circRNAs. Circ0043898 was successfully overexpressed within ECA-109 and Kyse-520 cells.
Figure 4. Validation of the circular structure of circ0043898. A. The cDNA of circ0043898 can be amplified by both divergent and convergent primers, but gDNA can be amplified only by convergent primers. B. Spliced joint position was validated using Sanger sequencing. C. RT-PCR for in total of 24 pairs of specimens proved that circ0043898 was down-regulated in the esophageal cancerous tissues. D. Plot graph for the expression level of circ0043898 in 24 pairs of specimens.
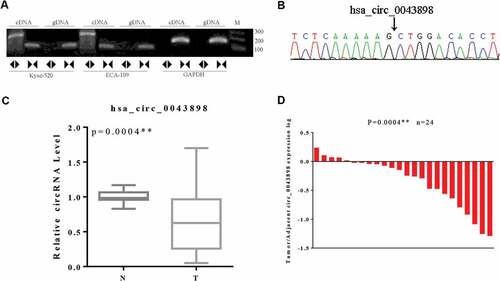
Figure 5. Validation of the capacity of cell proliferation in ECA-109 and Kyse-520 cells. A. The expression level of circ0043898 within different cell lines. B. The performance of the overexpression vector of circ0043898 in ECA-109 and Kyse-520 cells. C. MTS assay determined the capacity of cell proliferation in ECA-109 and Kyse-520 cells. D. Cell colony formation assay proved that circ0043898 can inhibit cell proliferation of ECA-109 and Kyse-520 cells.
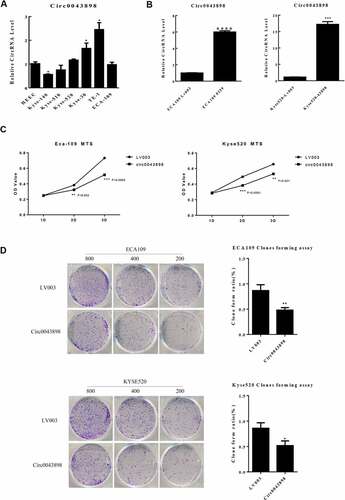
Figure 6. Cell assays to verify the functions of circ0043898 in regulating cell migration and invasion, cell apoptosis and cell cycle. A. Overexpression of circ0043898 inhibited the capacity of cell migration and invasion in ECA-109 and Kyse-520 cells. B. Cell apoptosis assay presented that the overexpression of circ0043898 raised the cell apoptosis rate in ECA-109 and Kyse-520 cells. C. The overexpression of circ0043898 retained the cell in G1 phase.
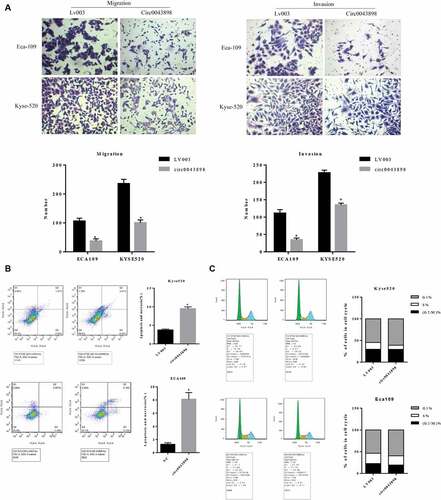
Figure 7. In vivo animal studies to verify the functions of circ0043898. A. The cells with/without circ0043898 overexpression were injected to the chest of the mice and thereby tumors were generated. B. The size of the tumor collected from the mice. C. The volumes of the tumors in different period after the cells were injected. D. The comparison of the weight of the tumors formed by the cells with/without circ0043898 overexpression. E. Immunohistochemical staining for the tumor tissues.
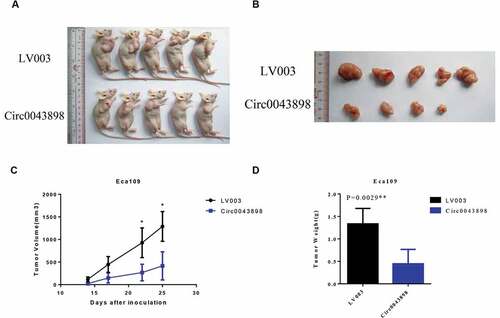
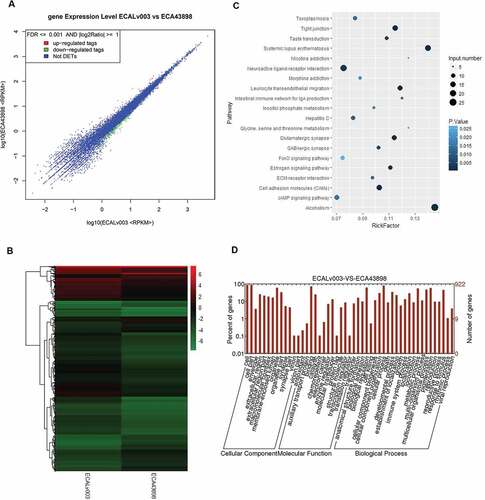
Figure 8. RNA-seq analysis for the ECA-109 cells with/without circ0043898 overexpression treatment. A. Dot graph for the up-regulated and down-regulated differentially expressed genes. B. Cluster graph for the up-regulated and down-regulated differentially expressed genes. C. Pathway enrichment for the significant differentially expressed genes. D. GO functional analysis for the differentially expressed genes.