Figures & data
Figure 1. Ixazomib inhibits cell proliferation and induces apoptosis in CRC. (A) The indicated cell lines were treated with increasing concentrations of ixazomib for 72 hours. Cell proliferation was analyzed by MTS assay. (B) HCT116 cells were treated with ixazomib for 24 hours. Indicated protein level was analyzed by Western blotting. (C) HT29 cells were treated with ixazomib for 24 hours. ATP level (upper) and HMGB1 release (lower) were analyzed. (D) Indicated cell lines were treated with ixazomib for 24 hours at indicated concentrations. Apoptosis was analyzed by Annexin V/PI staining followed by flow cytometry. (E) HCT116 cells were treated with ixazomib with or without z-VAD-fmk, caspase 3/7 activity was determined by fluorogenic analysis. (F) The indicated cell lines were treated with 10 μmol/L ixazomib at indicated time point. Cleaved caspase 3 and 8 were analyzed by western blotting. Results in (A), (D) and (F) were expressed as means ± SD of 3 independent experiments. **, P < 0.01; *, P < 0.05.
Figure 2. DR5 is required for ixazomib-induced apoptosis. (A) HCT116 cells were treated with 10μmol/L ixazomib at indicated time point. Indicated protein levels were analyzed by western blotting. (B) HCT116 cells were treated with ixazomib at indicated concentration. DR5 expression was analyzed by western blotting. (C) HCT116 cells were treated with 10μmol/L ixazomib at indicated time points. DR5 mRNA level was analyzed by gel electrophoresis. β-Actin was used as a control for normalization. (D) HCT116 cells were treated with ixazomib for 24 hours at indicated concentration. mRNA expression of DR5 and DR4 were analyzed by semiquantitive reverse transcription PCR (RT-PCR). (E) Parental and DR5-KD HCT116 cells were treated with 10μmol/L ixazomib for 24 hours. DR5 expression was analyzed by western blotting. (F) Parental and DR5-KD HCT116 cells were treated with 10μmol/L ixazomib for 24 hours. Apoptosis was analyzed by flow cytometry. (G) Parental and DR5-KD HCT116 or DLD1 cells were treated with 10μmol/L ixazomib 24 hours. Cleaved caspase 3 and 8 were analyzed by western blotting. Results in (D) and (F) were expressed as means ± SD of 3 independent experiments. **, P < 0.01; *, P < 0.05.
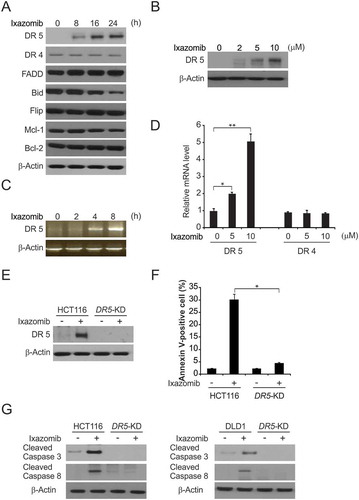
Figure 3. Caspase 8 and FADD mediated ixazomib-induced apoptosis. (A) Parental and FADD-KD HCT116 cells were treated with 10 μmol/L ixazomib for 24 hours. Apoptosis was analyzed by a nuclear fragmentation assay. (B) Parental and FADD-KD HCT116 cells were treated with 10 μmol/L ixazomib for 24 hours. Cleaved caspase 3 and 8 were analyzed by western blotting. (C) Parental and Cas 8-KD HCT116 cells were treated with 10 μmol/L ixazomib for 24 hours. Apoptosis was analyzed by a nuclear fragmentation assay. (D) Parental and Cas 8-KD HCT116 cells were treated with 10 μmol/L ixazomib for 24 hours. Cleaved caspase 3 and 8 were analyzed by Western blotting. (E) The images of representative fields of nuclear staining as treatment in (A) and (C). Results in (A) and (C) were expressed as means ± SD of 3 independent experiments. **, P < 0.01.
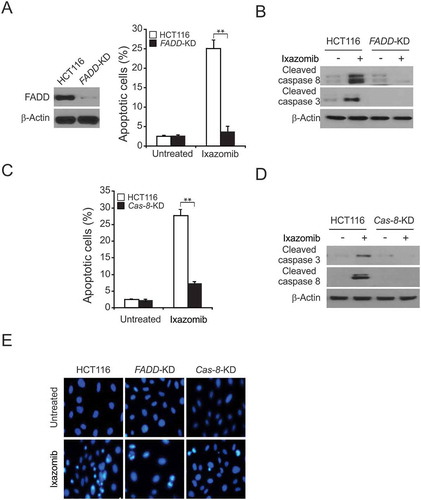
Figure 4. CHOP-mediated ixazomib-induced DR5 expression. (A) HCT116 cells were treated with 10 μmol/L ixazomib at indicated time point. Indicated protein expression was analyzed by western blotting. (B) WT and p53-KO HCT116 cells were treated with 10 μmol/L ixazomib for 24 hours. DR5 and p53 were analyzed by Western blotting. (C) WT and p53-KO HCT116 cells were treated with 10 μmol/L ixazomib for 24 hours. DR5 mRNA level was analyzed by Real-time PCR. (D) HCT116 cells were treated with 10 μmol/L ixazomib at indicated time point. Indicated protein expression was analyzed by western blotting. (E) HCT116 cells were treated with 10μmol/L ixazomib at indicated time point. CHOP mRNA level was analyzed by real-time PCR. (F) HCT116 cells transfected with si control or si CHOP were treated with 10 μmol/L ixazomib for 24 hours. CHOP, DR5 and cleaved caspase 3 were analyzed by western blotting. (G) Chromatin immunoprecipitation (ChIP) was performed using anti-CHOP antibody on HCT116 cells following ixazomib treatment for 12 hours. ChIP with the control IgG was used as a control. PCR was carried out using primers surrounding the CHOP binding sites in the DR5 promoter. Results in (C) were expressed as means ± SD of 3 independent experiments. **, P < 0.01; *, P < 0.05.
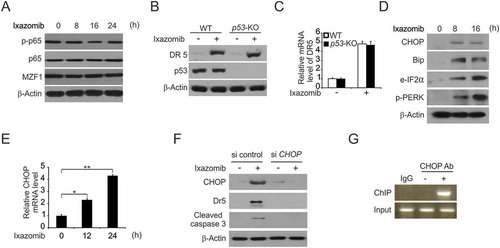
Figure 5. Ixazomib sensitizes TRAIL-mediated apoptosis. (A) HCT116 cells were treated with 5 μmol/L or 10 μmol/L ixazomib, 10 ng/mL TRAIL or their combination with or without 10 μmol/L z-VAD-fmk for 24 hours. Apoptosis was analyzed by flow cytometry. (B) HCT116 cells were treated with 5 μmol/L ixazomib, 10 ng/mL TRAIL or their combination for 24 hours. Cleaved caspase 3 and 8 were analyzed by western blotting. (C) HCT116 cells were treated with the combination of 5 μmol/L ixazomib and 10 ng/mL TRAIL with or without 10 μmol/L z-VAD for 24 hours. Cleaved caspase 3 was analyzed by western blotting. (D) Parental and DR5-KD HCT116 cells were treated with 5 μmol/L ixazomib, 10ng/mL TRAIL or their combination for 24 hours. Apoptosis was analyzed by a nuclear fragmentation assay. (E) Parental and DR5-KD HCT116 cells were treated with 5 μmol/L ixazomib, 10 ng/mL TRAIL or their combination for 24 hours. Cleaved caspase 3 and 8 were analyzed by western blotting. (F) Parental and DR5-KD DLD1 cells were treated with 5 μmol/L ixazomib, 10 ng/mL TRAIL or their combination for 24 hours. Cleaved caspase 3 and 8 were analyzed by western blotting. Results in (A) and (C) were expressed as means ± SD of three independent experiments. ***, P < 0.001; **, P < 0.01; *, P < 0.05.
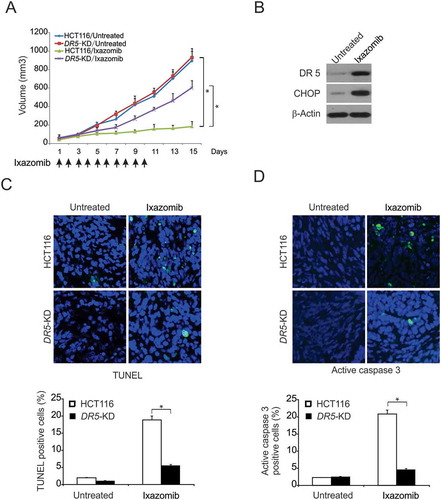
Figure 6. DR5-mediated antitumor effect of ixazomib in vivo. (A) Nude mice were injected s.c. with 4 × 10⁶ parental or DR5-KD HCT116 cells. After 1 week, mice were oral gavaged with 20 mg/kg ixazomib or the vehicle control for 10 consecutive days. Tumor volume at indicated time points after treatment was calculated and plotted with p values, n = 6 in each group. Arrows indicate ixazomib injection. (B) Mice with parental HCT116 xenograft tumors were treated with 20 mg/kg ixazomib or the vehicle as in (A) for 4 consecutive days. The levels of CHOP and DR5 in randomly selected tumors were analyzed by western blotting. (C) Paraffin-embedded sections of parental or DR5-KD tumor tissues from mice treated as in (B) were analyzed by TUNEL staining. Upper, representative TUNEL staining pictures; Lower, TUNEL-positive cells were counted and plotted. (D) Tissue sections from (C) were analyzed by active caspase 3 staining. Upper, representative staining pictures; Lower, active caspase 3-positive cells were counted and plotted. In (C)–(D), results were expressed as means ± SD of 3 independent experiments. *, P < 0.05.