Figures & data
Table 1. Clinicopathologic features of 77 patients with NEN.
Table 2. Different architectured types releted to site of origine.
Table 3. PDGFRα expression on different grade of NEN.
Table 4. PDGFRa expression on different grade of NEN.
Table 5. PDGFRα intensity score on neoplastic cells.
Figure 1. Representative patterns of PDGFRα in different architectural types: A) insular solid type B) acinar type C) trabecular type D) poorly-differentiated type. (magnification 20×).
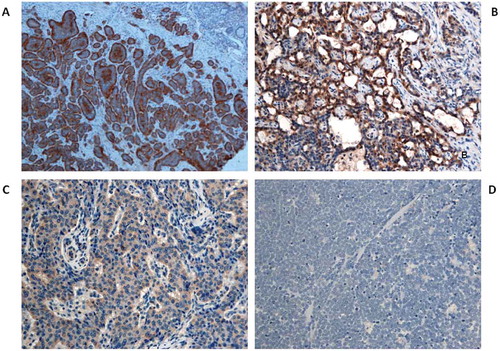
Figure 2. A-B) PDGFRα tissue expression in the insular solid growth pattern C-D) PDGFRα staining localized in the vascular pole of the neuroendocrine cell.
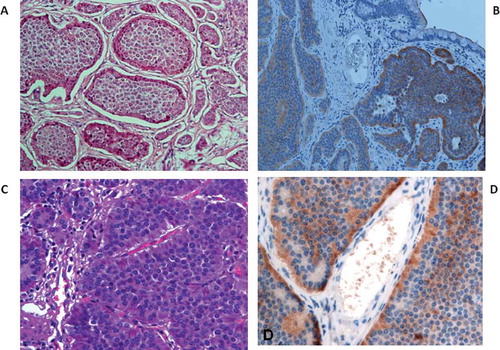
Figure 3. Representative PDGFRα staining in Enterochromaffin (EC) cells with a finely granular positivity with peripheral-membranous enhancement at the vascular pole of neuroendocrine cells.
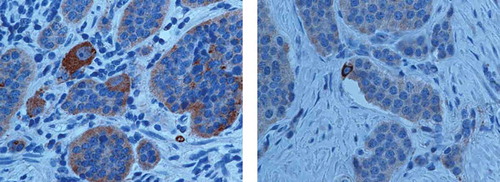
Figure 4. Association between the PDGFRα score and Ki67 index in NENs patients p < 0.001): Box plots of PDGFRα score and Ki67 index (expression %) *** = p < 0.001.