Figures & data
Figure 1. Time chart of treatment. Chemoradiotherapy was not effective in the patient after recurrence. However, NGS alleviated the patient’s disease twice and extended the patient’s survival by almost one year. The red triangles represented the progression of disease, while green triangles represented disease remission.
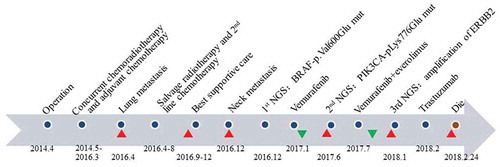
Figure 2. Imaging changes of targeted therapy. The patient developed extensively after radiotherapy and chemotherapy and performed a PET-CT examination (A) on 16 November 2016. Vemurafenib was indicated as a potential benefit drug after NGS. CT scans 2 (B) and 4 (C) months later confirmed its effectiveness. However, CT examination on 19 Jun 2017 (D) found extensive progress in the lung and a second NGS was carried out. Everolimus might be another beneficial drug and the patient took everolimus along with vemurafenib. CT examination on 27 July 2017 (E) suggested lung lesions shrank again.
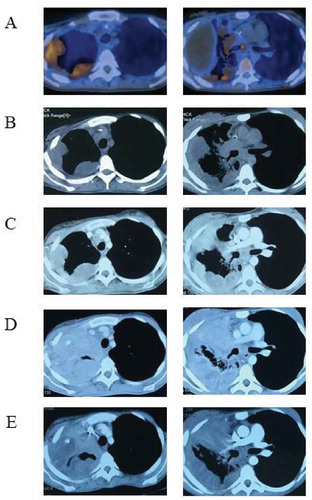
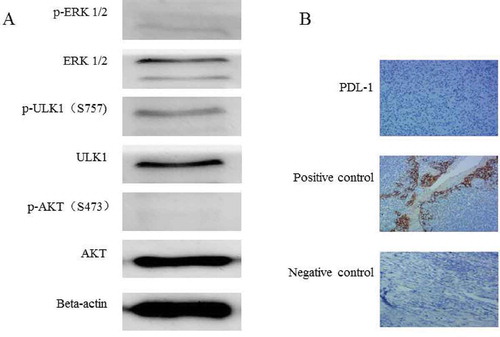
Figure 3. Molecular analysis of the biopsy tissue from lung metastasis. (A) The phosphorylation of ERK1/2 and AKT(S473)was weak in the metastatic tissue,and the phosphorylation of ULK-1 S757 was relatively strong. (B) The PDL-1 expression was negative in the biopsy tissue of lung metastases (IHC 10 × 10).