Figures & data
Table 1. Correlation between the expression of HNF1A-AS1 and clinicopathological features of OSCC patients. (n = 62).
Table 2. Multivariate analysis of prognostic parameters in patients with OSCC by Cox regression analysis.
Figure 1. High expression of HNF1A-AS1 predicted unfavorable prognosis for patients with OSCC. A-B. The expression pattern of HNF1A-AS1 in OSCC tissues and cells was examined by qRT-PCR. C. The correlation between the HNF1A-AS1 expression and the overall survival of patients with OSCC was analyzed with Kaplan-Meier analysis. *P < 0.05, **P < 0.01 vs. control group.
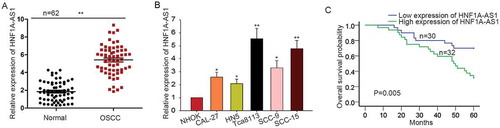
Figure 2. HNF1A-AS1 knockdown suppressed OSCC cell proliferation by inducing cell apoptosis and causing cell cycle arrest. A. The high expression of HNF1-AS1 was interfered by specific shRNAs (sh-HNF1A-AS1#1, sh-HNF1A-AS1#2, and sh-HNF1A-AS1 #3). The interference efficiency was obtained at 48 hours’ post-transfection. B-C. MTT and CCK8 assays were applied to detect the effects of silenced HNF1A-AS1 on the cell proliferation of SCC-15 and Tca8113 cells. D. Colony formation assay was conducted to detect the effect of silenced HNF1A-AS1 on cell proliferation. E. The expression of ki-67 and PCNA was examined in SCC-15 and Tca8113 cells transfected with sh-HNF1A-AS1. F-G. Cell cycle distribution and cell apoptosis were analyzed in SCC-15 and Tca8113 cells transfected with sh-HNF1A-AS1. *P < 0.05, **P < 0.01 vs. control group.
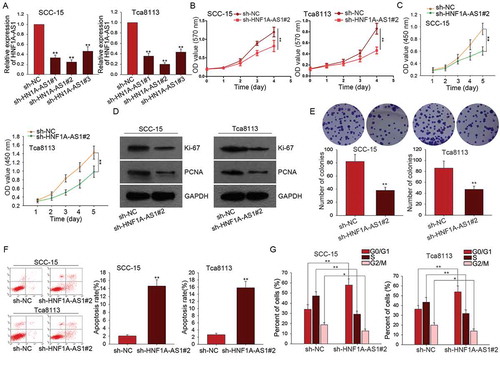
Figure 3. Knockdown of HNF1A-AS1 inhibited OSCC cell migration and epithelial-mesenchymal transition. A. Transwell assay was used to detect cell migration in OSCC cells in response to HNF1A-AS1 knockdown. B. The expression of EMT-related proteins was examined in OSCC cells transfected with sh-HNF1A-AS1. C. EMT markers were detected in indicated OSCC cells by immunofluorescence. **P < 0.01 vs. control group.
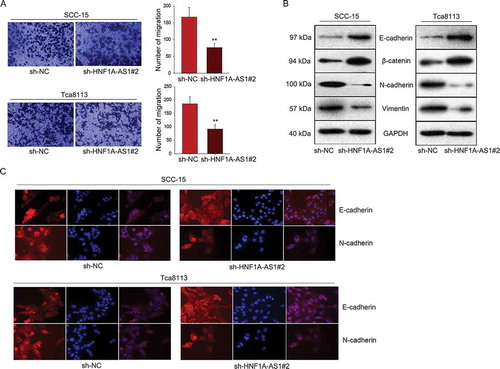
Figure 4. STAT3 is a transcription activator of HNF1A-AS1. A. The expression of STAT3 in OSCC tissues was examined by qRT-PCR. B. The relevance between the expression of STAT3 and that of HNF1A-AS1 in OSCC tissues was analyzed by Pearson correlation analysis. C. The levels of STAT3 and p-STAT3 were detected in OSCC cells and normal cell line. D. The mRNA level of STAT3 in OSCC cell lines and one normal cell line was detected with qRT-PCR. E. The expression of HNF1A-AS1 was examined in response to STAT3 overexpression or knockdown. F. The motif of STAT3 binding sequence was obtained from JASPAR. G. Top five binding sites of STAT3 in part 1 (P1) and part 2 (P2) of HNF1A-AS1 promoter were predicted and obtained from JASPAR. H. ChIP assay further demonstrated the affinity of STAT3 to the part 1 (P1) of HNF1A-AS1 promoter. I. The luciferase reporter assay was conducted to determine the binding condition of three sites of P1. J. The levels of STAT3 and p-STAT3 were detected in cells transfected with si-JAK1 or si-JAK2. K. The luciferase reporter assay was conducted in two OSCC cells transfected with STAT3 expression vector and si-JAK1. **P < 0.01 vs. control group.
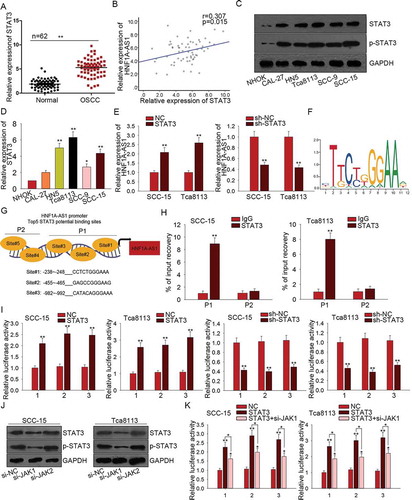
Figure 5. HNF1A-AS1 enhanced the activity of Notch signaling in OSCC cells. A. The protein levels of Notch1 and Hes1 in normal tissue and OSCC tissues were determined by western blot. B. The protein levels of Notch 1 and Hes1 were tested in two OSCC cells (SCC-15 and Tca8113) and NHOK cell. C. F. The protein level of Notch1 and Hes1 was detected in HNF1A-AS1-downregulated OSCC cells. **P < 0.01 vs. control group.
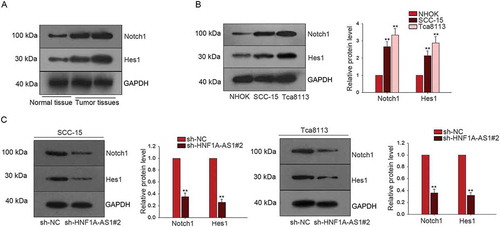
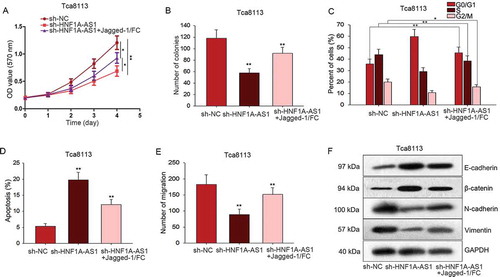
Figure 6. HNF1A-AS1 facilitated OSCC progression by activating Notch signaling pathway. A-B. MTT and colony formation assays were conducted to demonstrate the decreased proliferation ability caused by sh-HNF1A-AS1 could be rescued by Jagged-1/Fc (activator of Notch signaling). C. Stagnant cell cycle of OSCC cells caused by sh-HNF1A-AS1S could be rescued by Jagged-1/Fc. D. Flow cytometry analysis helped us find the increased apoptosis rate in HNF1A-AS1 downregulated OSCC cells could be reduced again by adding Jagged-1/Fc. E. The migratory ability was tested and observed when Tca8113 cell was co-transfected with sh-HNF1A-AS1 and Jagged-1/FC. F. The expression patterns of EMT markers were observed in indicated Tca8113 cell. *P < 0.05, **P < 0.01 vs. control group.