Figures & data
Table 1. Sequences of all primers used in this study.
Figure 1. Overview of differentially expressed genes in colon cells exposed to FVIIa. (A) Cluster dendrogram and volcano plot showed the general view of differentially expressed genes. (B) 13 malignancy-related genes were selected for qRT-PCR, and the results of 10 genes were consistent with the microarray. (C) Linear-regression analysis of the consistence of the results of microarray and qRT-PCR. *P<0.05, **P<0.01.
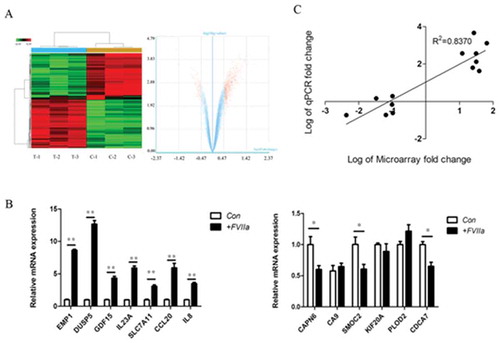
Figure 2. Network analysis of differentially expressed genes. (A) Network of differentially expressed genes. Red spot indicated upregulated gene, blue spot indicated downregulated gene, the line between the spots indicated their correlation. (B) Network of differentially expressed genes related pathways. Red spot indicated upregulated pathway, blue spot indicated downregulated pathway, yellow spot indicated both upregulated and downregulated pathway, the line between the spots indicated their correlation.
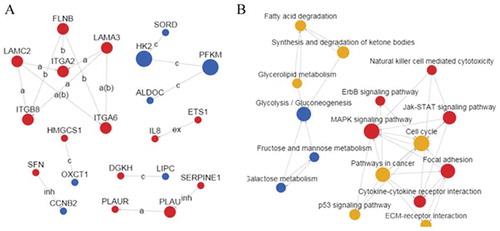
Figure 3. TF knockdown by siRNA blocked FVIIa induced AREG upregulation in LoVo cells. (A) TF expression was significantly downregulated in group TFi at mRNA and protein levels. (B) AREG expression was significantly upregulated in group FVIIa but downregulated in group TFi+ FVIIa. *P<0.05, **P<0.01.
Figure 4. FVIIa promotes the phosphorylation of EGFR. Western blot analysis of EGFR phosphorylation at Y-845 site. *P<0.05.
Figure 5. EGF activated TF/FVIIa pathway in LoVo cells. (A) Expression of downstream genes of TF/FVIIa pathway MMP7, ATG5 and PAR2 was significantly upregulated. (B) FVIIa expression was significantly increased by EGF in a dose and time dependent manner. **P<0.01.
Figure 6. Comparison of the interaction of TF/FVIIa and EGFR pathways between LoVo (mutant KRAS) and HT-29 (wild-type KRAS) cells. (A) mRNA expression of EGFR ligands. (B) Protein expression of EGFR ligands. (C) EGF significantly increased mRNA expression of FVII in LoVo cells, but FVII mRNA was not detected in both control and EGF stimulated HT-29 cells. *P<0.05.