Figures & data
Table 1. Hematology test results of peripheral blood prior to and after treatments.
Figure 1. Summary of CT scan and pathological assessment. A Image of Wright stained peripheral blood smear (200x); a large number of eosinophils (red) were observed. B-C Wright-Giemsa stained bone marrow smear (B, 200x; C, 1000x); a large amount of orange eosinophil was observed. D-F Pictures of CT scans at different heights. In D, osteolytic lesions were observed in vertebrae (arrow); E reveals osteolytic lesions in a rib and the vertebrae (arrows); in F, osteolytic lesions were found in another rib (arrow). G-I Pictures of tenderness area rib biopsy stained with hematoxylin/eosin (G, 100x; H, 400x; I, 1000x), numerous orange or red eosinophils were observed.
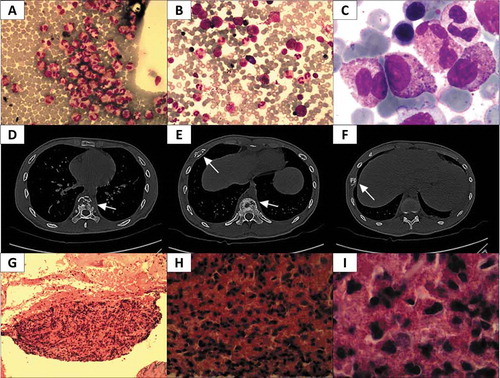
Figure 2. Summary of whole exome sequencing. The upper sequences in each diagram represent gene sequences and lower green and blue strips are amino acid sequences. A The diagram reveals a point mutation (C→T) at p.P6L in exon 2 of the PDGFRA gene. The point mutation is a missense mutation in chromosome 4 which alters its corresponding amino acid (P→L). B The diagram indicates a point mutation (G→A) at p.S869N in exon 20 of the MYOM2 gene. The point mutation is a missense mutation in chromosome 8 that leads to a change in the corresponding amino acid (S→N). C The diagram shows a point mutation (A→G) at p.T1751A in exon 12 of the ASXL3 gene. This is a missense mutation on chromosome 18 causing a substitution of its corresponding amino acid (T→A).
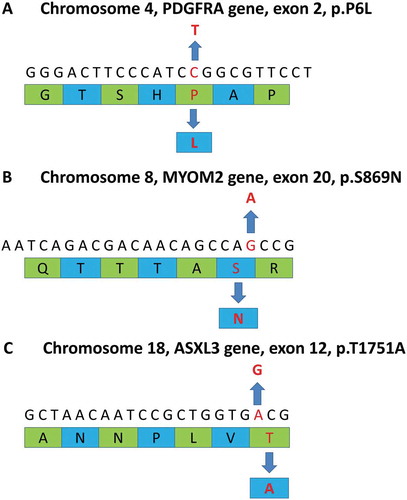
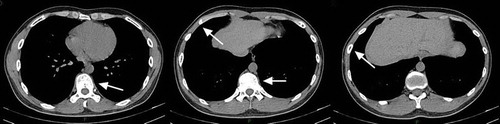
Figure 3. Picture of CT scan from return visit. All the original bone damages recovered (shown by arrows).