
Figures & data
Figure 1. SNHG5 was overexpressed in colorectal cancer tissues and cells. (a) Volcano plot. (b) Heat map. (c) qRT-PCR results of SNHG5 in colorectal cancer tissues and adjacent normal tissues. (d) qRT-PCR results of SNHG5 in colorectal cancer cell lines RKO, SW480, LoVo and normal colorectal mucosa cell line FHC. * P<0.05, ** P<0.01, compared with control group.
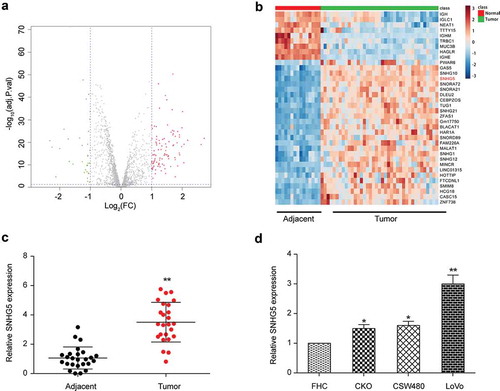
Figure 2. SNHG5 regulated the expression of miR-132-3p in LoVo cells (a) Transfection efficiency of si-SNHG5 was verified by qRT-PCR. (b) qRT-PCR results of miR-132-3p, miR-155, miR-205 and miR-150 in si-SNHG5 group and NC group. (c) qRT-PCR results of miR-132-3p in colorectal cancer tissues and adjacent normal tissues. (d) Bioinformatics predicted the binding sites of SNHG5 and miR-132-3p. (e) RNA pull down experiments demonstrated SNHG5 bound to miR-132-3p. (f) Dual luciferase assay detected the relationship between SNHG5 and miR-132-3p. (g) qRT-PCR detected the expression of SNHG5 in LoVo cells transfected with NC or miR-132-3p mimics. (h) The correlation between SNHG5 and miR-132-3p. * P<0.05, ** P<0.01, compared with NC group.
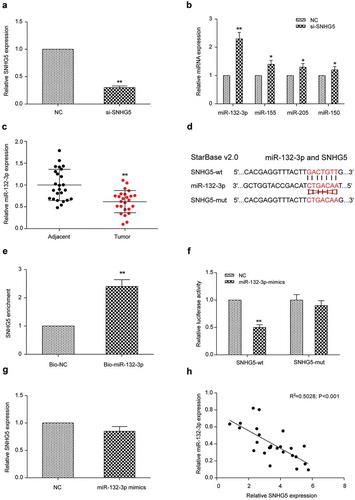
Figure 3. SNHG5 regulated miR-132-3p to promote colorectal cancer cell proliferation, migration and invasion. (a) Transfection efficiency was verified by qRT-PCR. (b) CCK-8 detected the proliferation of cells in miR-132-3p mimics group, miR-132-3p inhibitor group, si-SNHG5 group, si-SNHG5 + miR-132-3p inhibitor group and NC group. (c) (e) Transwell detected the relationship between SNHG5 and miR-132-3p and their effects on colorectal cancer cell invasion (× 200). (d) (f) Wound healing assay detected the relationship between SNHG5 and miR-132-3p and their effects on colorectal cancer cell migration (× 50). * P<0.05, ** P<0.01, compared with NC group.
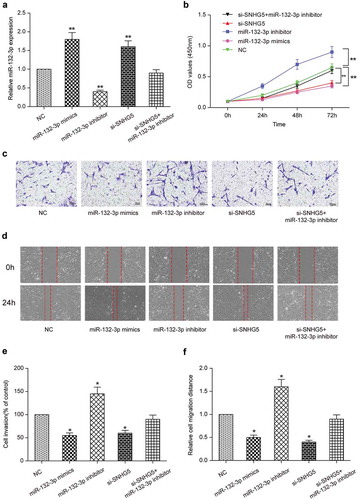
Figure 4. SNHG5 regulated miR-132-3p to inhibit apoptosis of colorectal cancer cells. (a) (b) Flow cytometry detected the relationship between SNHG5 and miR-132-3p and their effects on colorectal cancer cell apoptosis. * P<0.05, ** P<0.01, compared with NC group.
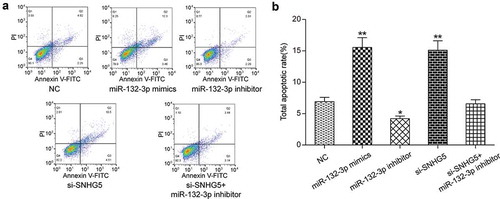
Figure 5. CREB5 was under-expressed in colorectal cancer tissues and cells. (a) Volcano plot. (b) Heat map. (c) qRT-PCR results of CREB5 in colorectal cancer tissues and adjacent normal tissues. (d) Western blot results of CREB5 in colorectal cancer tissues and adjacent normal tissues. ** P<0.01, compared with Adjacent group.
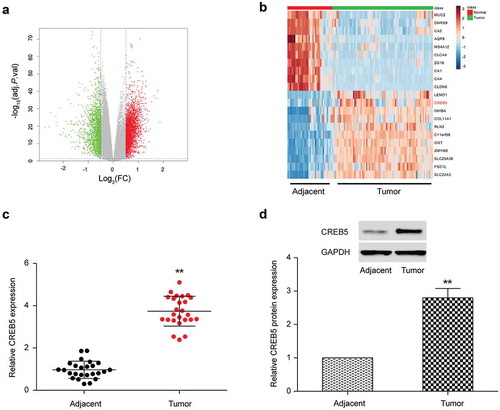
Figure 6. MiR-132-3p targeted the expression of CREB5 in LoVo cells. (a) Bioinformatics predicted the binding sites of miR-132-3p and CREB5. (b) The combination of miR-132-3p and CREB5-wt was detected by dual-luciferase reporter system. (c) The mRNA expression of CREB5 in miR-132-3p-mimics, miR-132-3p-inhibitor LoVo cells was detected by qRT-PCR. (d) The correlation between miR-132-3p and CREB5. (e,f) The CREB5 protein expression level in miR-132-3p-mimics, miR-132-3p-inhibitor LoVo cells was tested by Western blot. ** P<0.01, compared with NC group.
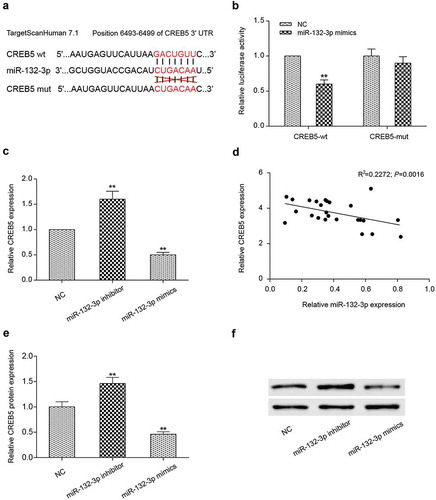
Figure 7. Effects of miR-132-3p on the proliferation, migration, invasion and apoptosis of colorectal cancer cells by targeting CREB5. (a) The expression of CREB5 in CREB5 group, si-CREB5 group, CREB5 + miR-132-3p-mimics group and NC group was detected by qRT-PCR in LoVo cells. (b) CCK-8 was used to detect the proliferation of four groups of cells. (c) Transwell was used to detect the invasion ability of four groups of cells (× 200). (d) The effects of miR-132-3p on cell migration through targeting CREB5 were detected by wound healing assay (× 50). (E) The apoptosis ability of four groups of cells was detected by flow cytometry. * P<0.05, ** P<0.01, compared with NC group.
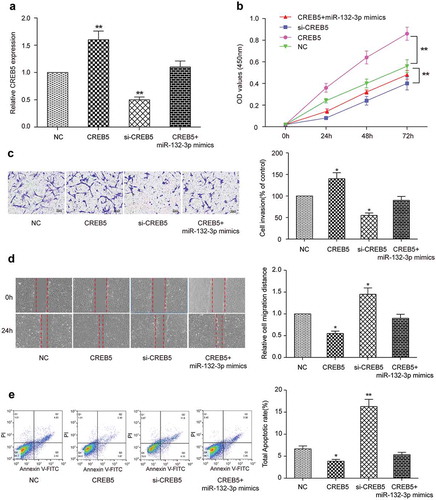
Figure 8. In vivo experiments verified the effect of lncRNA SNHG5 on colorectal cancer. (a) Subcutaneous tumors were removed from nude mice. (b) Changes in the volume of subcutaneous tumors of nude mice. (c) Changes in the weight of tumors extracted from nude mice. (d) Western blot detected CREB5 expression in the tumor tissues. * P<0.05, ** P<0.01, compared with NC group.
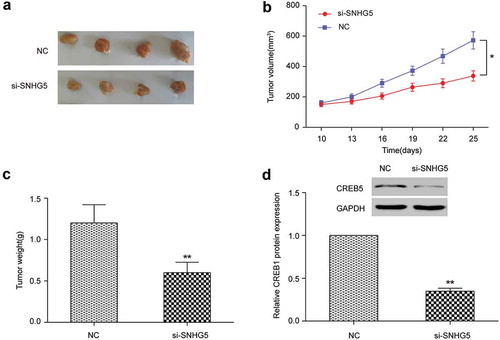
Figure 9. Effects of lncRNA SNHG5 or miR-132-3p on CREB family protein in CRC cells. (a,b) CREB1 and CREB3 protein expression levels decreased observably in si-SNHG5 group compared with NC group. (c,d) CREB1 and CREB3 protein expression levels were prominently increased in miR-132-3p inhibitor compared with NC group, while decreased in miR-132-3p mimics group. *P < 0.05, **P < 0.01, compared with NC group.
Table 1. Primers for qRT-PCR.