Figures & data
Figure 1. The expression of FOXP1 in normal lung tissues and lung cancer by Oncomine analysis. FOXP1 expression is decreased in lung cancer compared with normal lung. a-d figures were from different Oncomine databases.
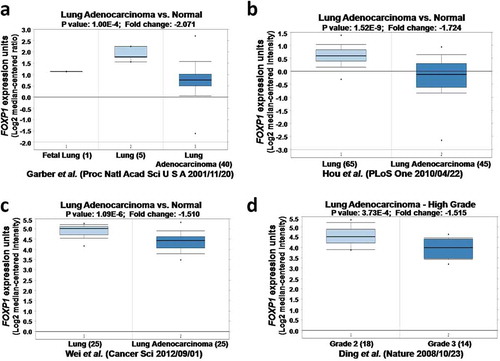
Figure 2. Knockdown of FOXP1 promotes the growth and invasion of lung cancer cells.
Western blot shows the protein expression of FOXP1 in A549 (a) and PC9 (d) cells 48 hrs after siFOXP1 treatment. Bar graphs show OD values of A549 (b) and PC9 (e) cells at 24h, 48h, and 72h after the knockdown of FOXP1. Flow cytometry analysis shows the apoptosis of A549 (c) and PC9 (f) cells 48 hrs after the knockdown of FOXP1. Representative pictures (g) and summarized data (h) show that the invasion of A549 and PC9 cells 48 hrs after the knockdown of FOXP1.* p < 0.05, ** p < 0.01, *** p < 0.001.
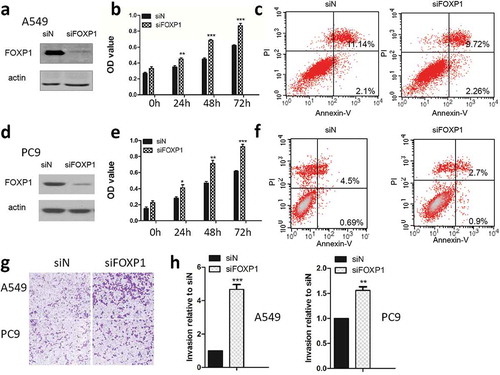
Figure 3. Chemokine signaling pathways are involved in FOXP1-mediated effect.
(a) Hierarchical clustering analysis reveals the alterations of transcripts in A549 cells treated with control or FOXP1 siRNA. (b) KEGG analysis of those significantly changed genes shows their enrichment in chemokine signaling pathway. (c and d) The heatmap of representative genes (c) and the RT-PCR validations (d), showing the alterations of CCR1, ADCY5, GNG7, VAV3, and PLCB1 after the knockdown of FOXP1. * p < 0.05, *** p < 0.001.
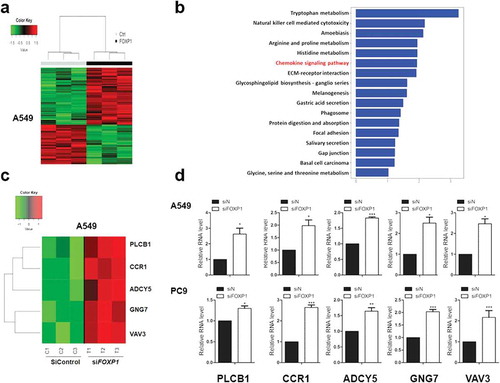
Figure 4. CCR1 is required for FOXP1-mediated effect.
(a and b) OD values of A549 (a) and PC9 (b) cells at 24h, 48h, and 72h after siFOXP1, siCCR1, or siFOXP1+ siCCR1 treatment. Upper panels are Western blot images showing the FOXP1 and CCR1 expression 48 hrs after the treatment of different siRNAs. Actin serves as loading control. (c and d) Bar graphs show the relative invasion of A549 (c) and PC9 (d) cells 48 hrs after siFOXP1, siCCR1, or siFOXP1+ siCCR1 treatment. (e) RT-PCR shows the expression levels of ADCY5, GNG7 and VAV3 but not PLCB1 48 hrs after the overexpression of CCR1. Inset is the gel picture of Western blot examining the expression of CCR1 in overexpressed cells. (f and g) Bar graphs show the luciferase activity in A549 (f) and PC9 (g) cells after 36 hrs of FOXP1 siRNA treatment. * p < 0.05, ** p < 0.01, *** p < 0.001.
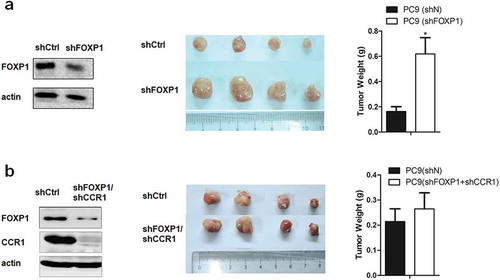
Figure 5. Downregulation of FOXP1 promotes the tumorigenesis via CCR1 in xenograft mouse model.
(a) Left panel shows the representative Western Blot image of PC9 cells treated with shFOXP1. Actin serves as the loading control. Middle panel shows the representative picture of tumors induced by PC9 cells treated with shCtrl or shFOXP1. Bar charts in the right panel show the weight of tumors generated by PC9 cells treated with shCtrl or shFOXP1. (b) Left panel shows the representative Western Blot image of PC9 cells treated with shFOXP1+ shCCR1. Actin serves as the loading control. Middle panel shows the picture of tumors induced by PC9 cells treated with shCtrl or shFOXP1+ shCCR1. Bar charts in the right panel show the weight of tumors generated by PC9 cells treated with shCtrl or shFOXP1+ shCCR1. * p < 0.05.