
Figures & data
Table 1. CTC positive rate (CTC number > 0) in different malignancies.
Table 2. Number of CTCs in analysis of triploid, tetraploid and polyploidy of chromosome 8.
Figure 1. CTCs distributions among ten prevalent cancers. (A) Images of CTCs with different chromosome 8 ploidies. CTCs nuclei were stained with DAPI (blue) and the chromosome 8 was illustrated with centromere probe 8 spectrum orange (red dots). (B) The CTC detection numbers are categorized to three groups, as more than five CTCs, ten CTCs and twenty CTCs in the patients with liver cancer, lung cancer, colorectal cancer, renal cancer, breast cancer, bladder cancer, gastric cancer, esophagus cancer, pancreatic cancer and ovarian cancer.
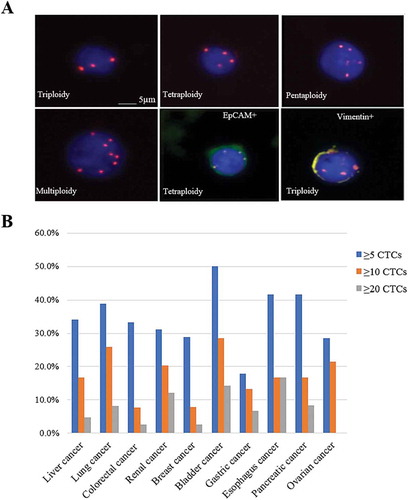
Table 3. Statistical analysis of ploidies and sizes of CTC in liver cancer patients with stage I & II and III & IV.
Table 4. Statistical analysis of ploidies and sizes of CTC in all 19 cancers with stage I & II and III & IV.
Table 5. Positive Expression rates of Vimentin, EpCAM and Vimentin/EpCAM on CTCs in liver cancer and all cancers.