Figures & data
Table 1. Sequences of primer pairs used for RT-qPCR.
Figure 1. NNT-AS1 is involved in osteosarcoma cell proliferation, survival and metastasis in vitro. Cells were assayed 24 hours after transfection for NNT-AS1 overexpression (O/E) or knockdown (KD). A, evaluation of NNT-AS1 in U2OS and OS-732 OS cells with NNT-AS1 overexpression or knockdown by transfection. Data of each group was normalized to that of wildtype (WT) U2OS cells transfected with control vector and presented as fold change. B, cell proliferation evaluated by CCK-8 method. Density of cells in each well on a 96-well plate correlated to absorbance at 450 nm (O.D 450 nm) after incubation with CCK-8 for 1 hour. C and D, colony formation assay evaluating clonogenicity of OS cells with or without NNT-AS1 overexpression or knockdown. C is a representative result of colony formation assay. E and F, flow cytometry evaluating Annexin V/PI surface staining of each group of cells after NNT-AS1 overexpression or knockdown. E is a representative result of flow cytometry. G and H, trans-well assay evaluating the invasiveness of OS cells with different NNT-AS1 expression. G is a representative result of trans-well assay. I and J, scratch assay evaluating cell mobility. I is a representative result of scratch assay. Vertical lines in each image indicate the width of the initial scratch at 0 hour. Data in panel D, H and J were normalized to WT group in the same panel and presented as fold change. Students’ t test was used for significance test in panel A, D, F, H and J, and two-way ANOVA was used for significance test in panel B. *, p < 0.05; **, p < 0.01; ***, p < 0.001; ****, p < 0.0001.
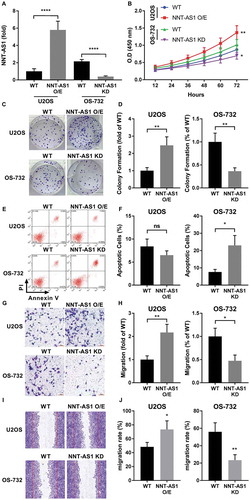
Figure 2. NNT-AS1 increased protein expression level of beta-catenin, RUNX2 as well as their down-stream genes MYC, Cyclin D1 and MMP-13 in OS cells in vitro, while inhibiting miR-320a. Cells were assayed 24 hours after transfection. A, B and C, western blot evaluating protein expression level of beta-catenin (CTNNB1) and RUNX2 in different group of cells. GAPDH was used as housekeeping genes. C is a representative result of western blot. D, RT-qPCR evaluating miR-320a expression level in each group of cells. E ~ H, western blot evaluating protein expression level of c-Myc (MYC), cyclin D1 (CCND1) and MMP-13 (MMP13). GAPDH was used as housekeeping genes. F is a representative result of western blot. Data normalized to the WT group and presented as fold change. Students’ t test was used for significance test. *, p < 0.05; **, p < 0.01.
Figure 3. Western blot showed that NNT-AS1 increased protein expression level of IGF-1R and Ser473 phosphorylation level of Akt in OS cells in vitro. Cells were treated and analyzed as described in . Total protein expression level of Akt was intact under NNT-AS1 overexpression or knockdown conditions. E is a representative result of western blot. Data in panel A ~ D were normalized to the WT in the same panel group and presented as fold change. Students’ t test was used for significance test. *, p < 0.05.
Figure 4. MiR-320a antagonized the OS-promoting role of NNT-AS1 in vitro. Cells were assayed 24 hours after transfection. A ~ D, western blot evaluating protein expression level of beta-catenin (CTNNB1), RUNX2 and IGF-1R in different group of cells. GAPDH was used as housekeeping genes. D is a representative result of western blot. E and F, cell proliferation assay by CCK-8 (as described in ), G and H, evaluation of cell apoptosis by flow cytometry. Cell apoptosis was determined by Annexin V positive staining. G is a representative result of flow cytometry. I and J, tran-well assay evaluating the invasiveness of each group of cells. I is a representative result of trans-well assay. Sidak’s multiple comparisons test was used for significance test in panel E and F, while students’ t test was used for significance test panel A, B, C, H and J. *, p < 0.05; **, p < 0.01; ***, p < 0.001; ****, p < 0.0001.
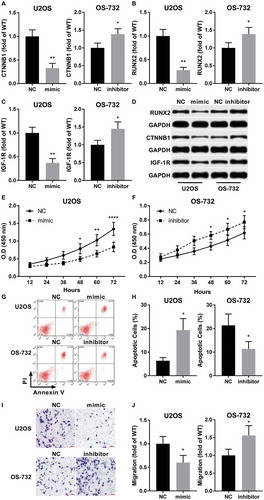
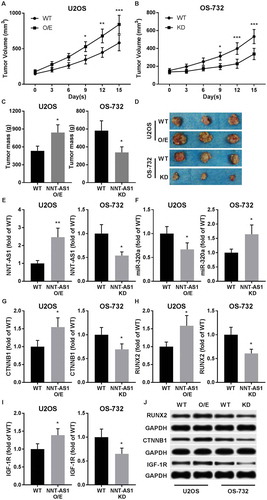
Figure 5. NNT-AS1 facilitated OS development in xenograft model. A and B, tumor formation assay evaluating tumor volume in tumor bearing nude mice. OS cells of different groups were subcutaneously injected on the left back of mice. Assay began when initial tumor volume formed by WT cells reached 150 mm3. C and D, tumor weight at the end-point of tumor formation assay. E and F, RT-qPCR evaluating NNT-AS1 and miR-320a in dissected tumor tissue. G ~ J, western blot evaluating protein expression level of beta-catenin (CTNNB1), RUNX2 and IGF-1R in dissected tumor tissues using GAPDH as housekeeping gene. J is a representative result of western blot. Data in panel C, E ~ I were normalized to WT group in the same graph. Sidak’s multiple comparisons test was used for significance test in panel A and B, while students’ t test was used for significance test in panel C, E ~ I. *, p < 0.05; **, p < 0.01; ***, p < 0.001.