Figures & data
Figure 1. Highly expressed ARAP1-AS1 predicted the unfavorable prognosis for patients with BCa.
A. The expression condition of ARAP1-AS1 in the BCa samples and normal controls was detected in TCGA database. B-C. qRT-PCR was performed to quantify the expression of ARAP1-AS1 in both BCa tissues and cell lines. D. Kaplan-Meier analysis was used to reveal the correlation between the expression of ARAP1-AS1 and the overall survival of patients with BCa. *p < 0.05 and **p < 0.01 vs. control group.
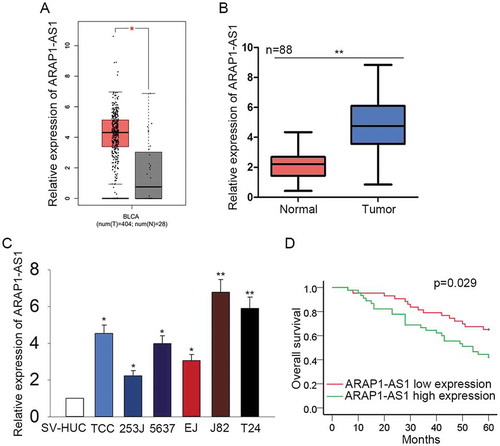
Figure 2. Knockdown of ARAP1-AS1 suppressed bladder cancer cell proliferation, migration and invasion.
A. High expression of ARAP1-AS1 was knocked down in J82 and T24 cells via transfecting specific shRNA (sh-ARAP1-AS1). Cells transfected with control shRNA (sh-NC) were used as the control group for subsequent experiments. B-C. Cell proliferative assays (MTT and colony formation assays) were performed in indicated T24 and J82 cells. D-E. Transwell assays were utilized to examine the migratory and invasive ability of J82 and T24 cells transfected with sh-ARAP1-AS1. **p < 0.01 vs. control group.
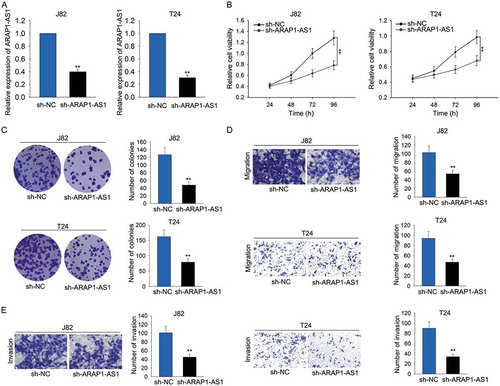
Figure 3. Knockdown of ARAP1-AS1 inhibited BCa cell growth in vivo.
A. Tumor derived from J82 cells stably transfected with sh-ARAP1-AS1 or sh-NC was observed. B-C. Both tumor volume and tumor weight were measured in response to ARAP1-AS1 knockdown. **p < 0.01 vs. control group.
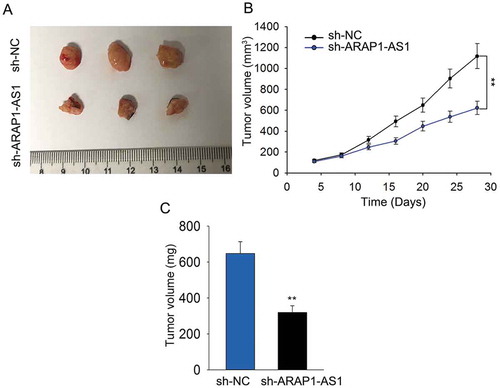
Figure 4. ARAP1-AS1 acted as a ceRNA to bind miR-4735-3p.
A. The localization of ARAP1-AS1 was identified in J82 and T24 cells with subcellular fractionation assay. B. Top ten miRNAs which can bind with ARAP1-AS1 were predicted and obtained from DIANA. C. MS2-RIP assay was carried out to determine which one of those ten miRNAs can bind with ARAP1-AS1 in BCa cells. D. The luciferase activity analysis was utilized to demonstrate the binding relation between ARAP1-AS1 and two candidate miRNAs. E. The binding sequence between the wild type ARAP1-AS1 (ARAP1-AS1-WT) or mutant type ARAP1-AS1 (ARAP1-AS1-MUT) and miR-4735-3p was obtained and illustrated. F. Further luciferase reporter assay was performed to confirm the combination between ARAP1-AS1 and miR-4735-3p. G. The level of ARAP1-AS1 was observed in BCa tissues using qRT-PCR. H. The expression relevance between ARAP1-AS1 and miR-4735-3p in BCa tissues was analyzed. I. The expression change of miR-4735-3p was detected in APAP1-AS1-dwonregulated BCa cells. **p < 0.01 vs. control group. N.S: no significance.
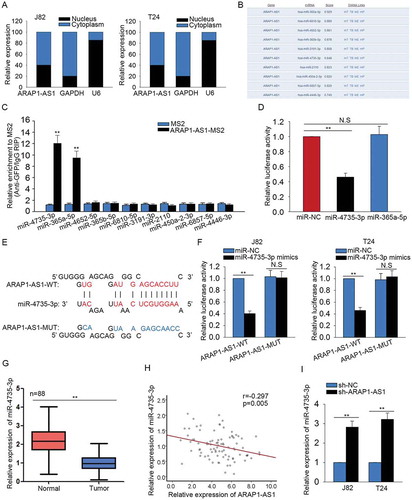
Figure 5. MiR-4735-3p exerted anti-oncogenic function in BCa.
A. The specific expression of miR-4735-3p in BCa cells and SV-HUC cell was identified. B. The level of miR-4735-3p was increased in J82 and T24 cells by transfecting with miR-4735-3p mimics. C-D. The proliferative ability of cells transfected with miR-4735-3p mimics was examined with MTT and colony forming assays. E-F. The influences of miR-4735-3p mimics on the migration and invasion of BCa cells were identified using transwell assays. *p < 0.05 and **p < 0.01 vs. control group.
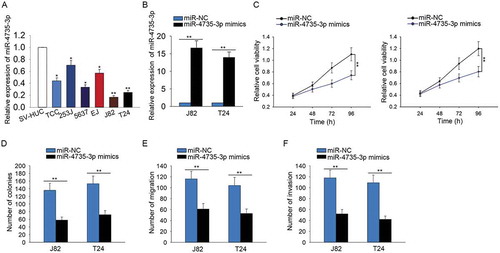
Figure 6. ARAP1-AS1 positively regulated NOTCH2 by sponging miR-4735-3p.
A. 457 potential target mRNAs of miR-4735-3p were found from targetScan. The expression change of all these mRNAs was detected in response to both sh-ARAP1-AS1 and miR-4735-3p mimics. B-C. The expression level of NOTH2 was examined with qRT-PCR in both BCa tissues and cell lines. D. The expression correlation between NOTH2 and miR-4735-3p in BCa tissues was analyzed (left). The expression correlation between ARAP1-AS1 and NOTCH2 was assessed (right). E. The putative binding sequence between NOTCH2 and miR-4735-3p obtained from targetScan. F. Dual luciferase reporter assay further validated the combination between miR-4735-3p and NOTCH2. G-H. Both mRNA and protein levels of NOTCH2 were tested in J82 and T24 cells transfected with miR-4735-3p mimics. I-J. The expression of NOTCH2 was tested in cells transfected with sh-ARAP1-AS1. *p < 0.05 and **p < 0.01 vs. control group.
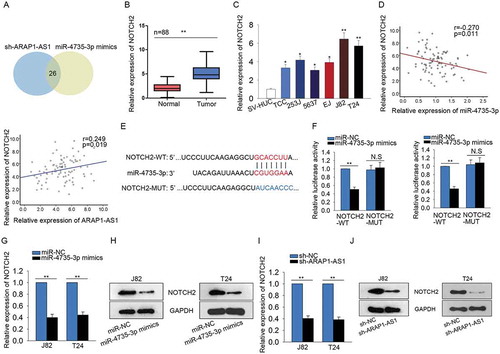
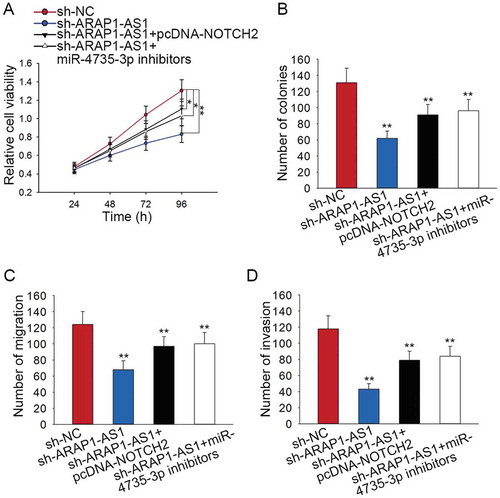
Figure 7. The effects of ARAP1-AS1-miR-4735-3p-NOTCH2 axis on the BCa progression.
A-B. Cell proliferation ability of indicated J82 cell was examined by applying rescue assays. C-D. The migration and invasion of J82 cell were tested by performing rescue assays. *p < 0.05 and **p < 0.01 vs. control group.