Figures & data
Figure 1. Pemetrexed and fingolimod interact to kill NSCLC cells. A. and B. Established human NSCLC lines (A549, H460, H1975, H661, H1299, H1437), a PDX NSCLC isolate ADOR, mouse Lewis Lung Carcinoma cells or tumor-derived H1975 (5 parental clones; 5 afatinib-resistant clones) were treated with vehicle control, pemetrexed (PTX, 500 nM), fingolimod (FTY, 200 nM) or the drugs in combination for 24h. Cells were then isolated and viability determined via a live/dead assay (n = 3 ± SEM). # p < 0.05 greater value than pemetrexed treatment alone. C. Established human ovarian cancer lines (OVCAR3, SKOV3) and a PDX isolate Spiky were treated with vehicle control, pemetrexed (PTX, 500 nM), fingolimod (FTY, 200 nM) or the drugs in combination for 24h. Cells were then isolated and viability determined via a live/dead assay (n = 3 ± SEM). # p < 0.05 greater value than pemetrexed treatment alone.
Figure 2. [Pemetrexed + fingolimod] treatment inactivates mTOR, activates the AMPK and ULK1 and simultaneously induces autophagosome and autolysosome formation. A. NSCLC cells were treated with vehicle control or with [pemetrexed (500 nM) + fingolimod (200 nM)] for 6h. After six h, cells were fixed in place and immunostaining performed to detect the expression and phosphorylation of the indicated proteins. Staining densities of phospho-/total-protein levels are determined in 40 cells in triplicate using software integral in the Hermes WiScan microscope (n = 120 cells ± SEM). # p < 0.05 greater than vehicle control value; * p < 0.05 less than vehicle control value. B. NSCLC cells were transfected with a plasmid to express LC3-GFP-RFP. Twenty-four h after transfection, cells were treated with vehicle control or with [pemetrexed (500 nM) + fingolimod (200 nM)] for 3h, 6h or 12h. At each time point the mean number of intense staining GFP+ and RFP+ vesicles in the cells was determined (at least 40 cells per condition were counted) (n = 120 cells ± SEM). # p < 0.05 greater than vehicle control value.
![Figure 2. [Pemetrexed + fingolimod] treatment inactivates mTOR, activates the AMPK and ULK1 and simultaneously induces autophagosome and autolysosome formation. A. NSCLC cells were treated with vehicle control or with [pemetrexed (500 nM) + fingolimod (200 nM)] for 6h. After six h, cells were fixed in place and immunostaining performed to detect the expression and phosphorylation of the indicated proteins. Staining densities of phospho-/total-protein levels are determined in 40 cells in triplicate using software integral in the Hermes WiScan microscope (n = 120 cells ± SEM). # p < 0.05 greater than vehicle control value; * p < 0.05 less than vehicle control value. B. NSCLC cells were transfected with a plasmid to express LC3-GFP-RFP. Twenty-four h after transfection, cells were treated with vehicle control or with [pemetrexed (500 nM) + fingolimod (200 nM)] for 3h, 6h or 12h. At each time point the mean number of intense staining GFP+ and RFP+ vesicles in the cells was determined (at least 40 cells per condition were counted) (n = 120 cells ± SEM). # p < 0.05 greater than vehicle control value.](/cms/asset/accce408-09c6-4071-902e-9afbdce38ff2/kcbt_a_1538616_f0002_b.gif)
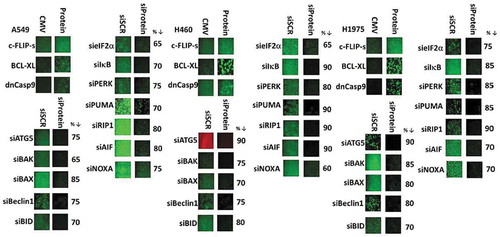
Figure 3. [Pemetrexed + fingolimod] lethality requires ATG5-dependent mitochondrial dysfunction leading to apoptotic and necroptotic death processes. A. and B. H460 and A549 NSCLC cells were transfected with the following plasmids to express: CMV/empty vector; c-FLIP-s; BCL-XL; dominant negative caspase 9; activated AKT; activated MEK1; activated mTOR; activated STAT3. Other H460 and A549 cells were transfected with the following siRNA molecules to knock down the expression of: control scramble, siSCR; apoptosis inducing factor, AIF; AMPKα subunit; ATM; BAX; BAK; Beclin1; BID; cathepsin B; ATG5; eIF2α; NOXA; PUMA; PERK; RIP-1; ULK1. Twenty-four h after transfection cells were treated with vehicle control or with [pemetrexed (500 nM) + fingolimod (200 nM)] for 24h. Cells were then isolated and viability determined via a live/dead assay (n = 3 ± SEM). * p < 0.05 lower value than the corresponding value in CMV/siSCR transfected cells; ** p < 0.01 lower value than the corresponding value in CMV/siSCR transfected cells; *** p < 0.05 less than corresponding value in activated AKT transfected cells; & p < 0.05 less death than corresponding value in H460 cells; ¶ p < 0.05 less than corresponding value in siBeclin1 transfected and in ULK1 transfected cells.
![Figure 3. [Pemetrexed + fingolimod] lethality requires ATG5-dependent mitochondrial dysfunction leading to apoptotic and necroptotic death processes. A. and B. H460 and A549 NSCLC cells were transfected with the following plasmids to express: CMV/empty vector; c-FLIP-s; BCL-XL; dominant negative caspase 9; activated AKT; activated MEK1; activated mTOR; activated STAT3. Other H460 and A549 cells were transfected with the following siRNA molecules to knock down the expression of: control scramble, siSCR; apoptosis inducing factor, AIF; AMPKα subunit; ATM; BAX; BAK; Beclin1; BID; cathepsin B; ATG5; eIF2α; NOXA; PUMA; PERK; RIP-1; ULK1. Twenty-four h after transfection cells were treated with vehicle control or with [pemetrexed (500 nM) + fingolimod (200 nM)] for 24h. Cells were then isolated and viability determined via a live/dead assay (n = 3 ± SEM). * p < 0.05 lower value than the corresponding value in CMV/siSCR transfected cells; ** p < 0.01 lower value than the corresponding value in CMV/siSCR transfected cells; *** p < 0.05 less than corresponding value in activated AKT transfected cells; & p < 0.05 less death than corresponding value in H460 cells; ¶ p < 0.05 less than corresponding value in siBeclin1 transfected and in ULK1 transfected cells.](/cms/asset/64bb2e57-75d5-4e56-9dd2-2e4eed14931e/kcbt_a_1538616_f0003_b.gif)
Figure 4. Down-regulation of Beclin1 delays but does not prevent autolysosome formation. NSCLC cells were transfected with a scrambled siRNA or an siRNA to knock down the expression of Beclin1. In parallel, the cells were transfected with a plasmid to express LC3-GFP-RFP. Twenty-four h later, cells were treated with vehicle control, [pemetrexed (500 nM) + fingolimod (200 nM)], everolimus (50 nM) or the three drugs in combination for 6h or 12h. At each time point the mean number of intense staining GFP+ and RFP+ vesicles in the cells was determined (at least 40 cells per condition were counted) (n = 120 cells ± SEM). * p < 0.05 less than corresponding vehicle control value.
![Figure 4. Down-regulation of Beclin1 delays but does not prevent autolysosome formation. NSCLC cells were transfected with a scrambled siRNA or an siRNA to knock down the expression of Beclin1. In parallel, the cells were transfected with a plasmid to express LC3-GFP-RFP. Twenty-four h later, cells were treated with vehicle control, [pemetrexed (500 nM) + fingolimod (200 nM)], everolimus (50 nM) or the three drugs in combination for 6h or 12h. At each time point the mean number of intense staining GFP+ and RFP+ vesicles in the cells was determined (at least 40 cells per condition were counted) (n = 120 cells ± SEM). * p < 0.05 less than corresponding vehicle control value.](/cms/asset/66470c21-9bc9-4e67-b2ec-6d9eb9b4df70/kcbt_a_1538616_f0004_b.gif)
Figure 5. Everolimus enhances [pemetrexed + fingolimod] lethality. A. NSCLC cells were treated with vehicle control, [pemetrexed (500 nM) + fingolimod (200 nM)], everolimus (50 nM) or the three drugs in combination for 12h. Cells were then isolated and viability determined via a live/dead assay (n = 3 ± SEM). # p < 0.05 greater value than [pemetrexed + fingolimod] treatment alone. B. Wild type parental H1975 clones and afatinib-resistant H1975 clones were treated with vehicle control, [pemetrexed (500 nM) + fingolimod (200 nM)], everolimus (50 nM) or the three drugs in combination for 12h. Cells were then isolated and viability determined via a live/dead assay (n = 3 ± SEM). * p < 0.05 less than 100%.
![Figure 5. Everolimus enhances [pemetrexed + fingolimod] lethality. A. NSCLC cells were treated with vehicle control, [pemetrexed (500 nM) + fingolimod (200 nM)], everolimus (50 nM) or the three drugs in combination for 12h. Cells were then isolated and viability determined via a live/dead assay (n = 3 ± SEM). # p < 0.05 greater value than [pemetrexed + fingolimod] treatment alone. B. Wild type parental H1975 clones and afatinib-resistant H1975 clones were treated with vehicle control, [pemetrexed (500 nM) + fingolimod (200 nM)], everolimus (50 nM) or the three drugs in combination for 12h. Cells were then isolated and viability determined via a live/dead assay (n = 3 ± SEM). * p < 0.05 less than 100%.](/cms/asset/84fd6ea4-3e61-4914-aa47-2c4dd26e42ac/kcbt_a_1538616_f0005_b.gif)
Figure 6. [Pemetrexed + fingolimod + everolimus] is ATG5-dependent and blocked by inhibition of caspases 8/10. A. NSCLC cells were transfected with a scrambled siRNA control or with siRNA molecules to knock down the expression of ATG5, Beclin1 or ULK1. Twenty-four h after transfection cells were treated with vehicle control, [pemetrexed (500 nM) + fingolimod (200 nM)], everolimus (50 nM) or the three drugs in combination for 24h. Cells were then isolated and viability determined via a live/dead assay (n = 3 ± SEM). * p < 0.05 less than corresponding value in siSCR transfected cells; ¶ p < 0.05 less than corresponding value in siBeclin1 cells. B. NSCLC cells were transfected with the following plasmids to express: CMV/empty vector; c-FLIP-s; BCL-XL; dominant negative caspase 9; activated AKT; activated MEK1; activated mTOR; activated STAT3. Twenty-four h after transfection cells were treated with vehicle control, [pemetrexed (500 nM) + fingolimod (200 nM)], everolimus (50 nM) or the three drugs in combination for 24h. Cells were then isolated and viability determined via a live/dead assay (n = 3 ± SEM). * p < 0.05 less than corresponding value in control CMV transfected cells.
![Figure 6. [Pemetrexed + fingolimod + everolimus] is ATG5-dependent and blocked by inhibition of caspases 8/10. A. NSCLC cells were transfected with a scrambled siRNA control or with siRNA molecules to knock down the expression of ATG5, Beclin1 or ULK1. Twenty-four h after transfection cells were treated with vehicle control, [pemetrexed (500 nM) + fingolimod (200 nM)], everolimus (50 nM) or the three drugs in combination for 24h. Cells were then isolated and viability determined via a live/dead assay (n = 3 ± SEM). * p < 0.05 less than corresponding value in siSCR transfected cells; ¶ p < 0.05 less than corresponding value in siBeclin1 cells. B. NSCLC cells were transfected with the following plasmids to express: CMV/empty vector; c-FLIP-s; BCL-XL; dominant negative caspase 9; activated AKT; activated MEK1; activated mTOR; activated STAT3. Twenty-four h after transfection cells were treated with vehicle control, [pemetrexed (500 nM) + fingolimod (200 nM)], everolimus (50 nM) or the three drugs in combination for 24h. Cells were then isolated and viability determined via a live/dead assay (n = 3 ± SEM). * p < 0.05 less than corresponding value in control CMV transfected cells.](/cms/asset/68f611ae-f529-40d9-9bb6-863609a8a51a/kcbt_a_1538616_f0006_b.gif)
Figure 7. Possible mechanisms by which pemetrexed and fingolimod/FTY720 interact to kill NSCLC cells. A schematic representing the signaling pathways and biology being examined in this manuscript. This includes inhibition of upstream signaling at the level of receptors; the activation of a DNA damage and ATM-AMPK response; and the regulatory pathways influencing autophagosome formation, autolysosome formation and the induction of tumor cell death.
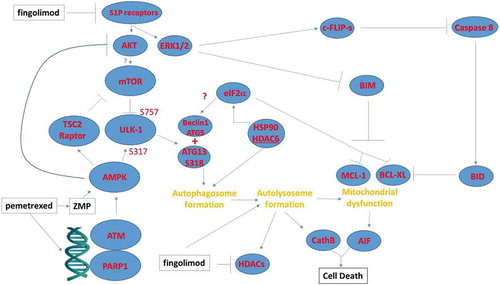
Figure 8. Control siRNA knock down images for the proteins whose expression was manipulated in this manuscript.