
Figures & data
Figure 1. The expression levels of the p53- and EMT-related proteins in drug-resistant cells and the corresponding drug-sensitive cells were determined using western blot analysis. The results are representative of three independent experiments (a) and quantified data are presented as the mean ± SD. *P < 0.05, **P < 0.01, ***P < 0.001 vs. the corresponding drug-sensitive cells (b). GAPDH was used as a loading control. Cells were treated with the indicated agents for 24 h, and cell survival was measured by an SRB assay in order to prove that the MDM2/MDMX inhibitor enhanced DOX-induced cytotoxicity in TNBC cells. The growth curves of specific treatments are shown: MDA-MB-231 treated with DOX alone or in combination with the nutlin-3a or MDM2/MDMX inhibitor (c), MDA-MB-231/DOX treated with DOX alone or in combination with the nutlin-3a or MDM2/MDMX inhibitor (d), HCC1937 treated with DOX alone or in combination with the MDM2/MDMX inhibitor (e) and MDA-MB-468 treated with DOX alone or in combination with the MDM2/MDMX inhibitor (f). The concentrations of nutlin-3a used in MDA-MB-231 and MDA-MB-231/DOX cells were 25.36 µM and 25.69 µM respectively. The concentration of the MDM2/MDMX inhibitor in MDA-MB-231, MDA-MB-231/DOX, HCC1937 and MDA-MB-468 cells was 33.16 nM, 38.28 nM, 36.78 nM and 41.49 nM respectively.
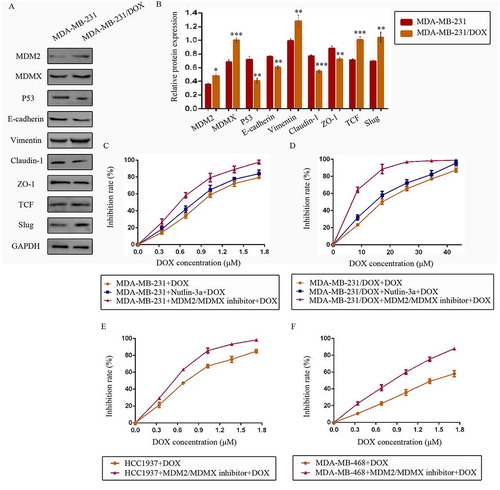
Figure 2. MDM2/MDMX inhibitor in combination with DOX inhibit TNBC cell invasion. Cells were treated with the indicated agents for 24 h, and cell invasion was detected using transwell assay. The concentrations of each agent were used as follow: DOX 0.29 µM in MDA-MB-231 cells, 5.14 µM in MDA-MB-231/DOX cells, 0.36 µM in MDA-MB-468 cells and 0.22 µM in HCC1937 cells, the MDM2/MDMX inhibitor 33.16 nM in MDA-MB-231 cells, 38.28 nM in MDA-MB-231/DOX cells, 41.49 nM in MDA-MB-468 cells and 36.78 nM in HCC1937 cells. The representative charts (a) and quantified data (b) of transwell are separately shown. The values presented are indicative of the mean ± SD for each group. *P < 0.05, **P < 0.01, ***P < 0.001 (n = 3) vs. the control group, the DOX only group or the MDM2/MDMX inhibitor group.
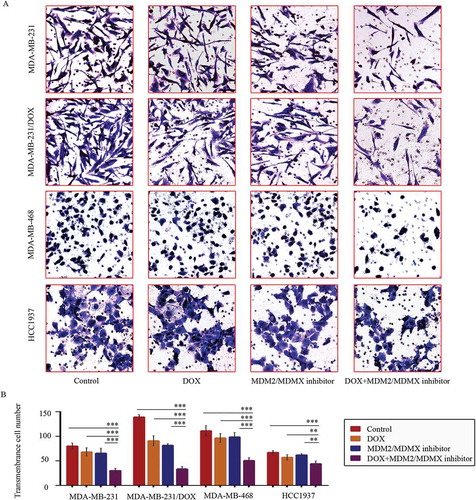
Figure 3. MDM2/MDMX inhibitor in combination with DOX inhibit TNBC cell migration. Cells were treated with the indicated agents for 24 h, and cell migration was detected using wound healing assay. The concentrations of each agent were used as follow: DOX 0.29 µM in MDA-MB-231 cells, 5.14 µM in MDA-MB-231/DOX cells, 0.36 µM in MDA-MB-468 cells and 0.22 µM in HCC1937 cells, the MDM2/MDMX inhibitor 33.16 nM in MDA-MB-231 cells, 38.28 nM in MDA-MB-231/DOX cells, 41.49 nM in MDA-MB-468 cells and 36.78 nM in HCC1937 cells. The representative charts (a) and quantified data (b) of wound healing assay are separately shown. The values presented are indicative of the mean ± SD for each group. *P < 0.05, **P < 0.01, ***P < 0.001 (n = 3) vs. the control group, the DOX only group or the MDM2/MDMX inhibitor group.
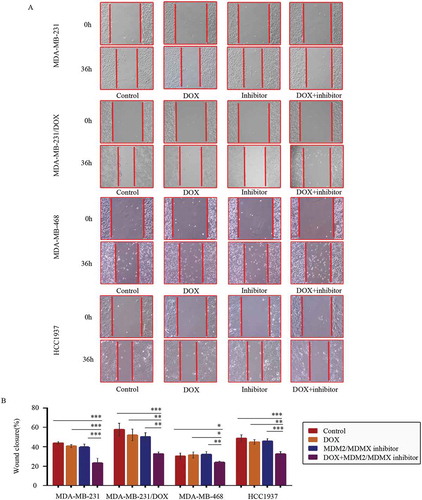
Figure 4. MDM2/MDMX inhibitor could enhance the curative effect of DOX in TNBC nude mice. Each mice was injected 1 × 10⁷ TNBC cells re-suspended in PBS mixed with matrigel into the mammary fat pad. When the tumors were approximately 200 mm3, tumor-bearing mice were randomly divided into four groups (six in each group) and treated with the following regimens: Normal saline; DOX alone (2.5 mg/kg, iv, twice per week); MDM2/MDMX inhibitor alone (10 mg/kg, iv, d1–3); and the combination of MDM2/MDMX inhibitor and DOX. The body weights of mice and tumor volumes were recorded every other day. The tumor volumes (a, c) and original tumors (b, c) are shown. The values presented are the mean ± SD for each group. *P < 0.05, **P < 0.01, ***P < 0.001 (n = 6) vs. the control group, the DOX only group or the MDM2/MDMX inhibitor alone group.
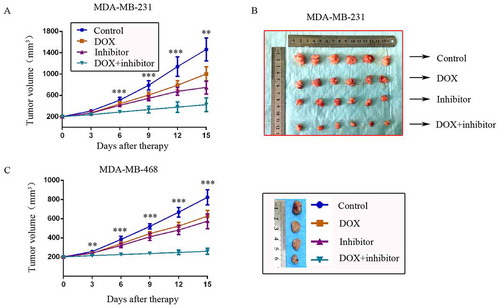
Figure 5. MDM2/MDMX inhibitor in combination with DOX could suppress EMT in TNBC nude mice. TNBC nude mice were killed and tumor tissues were excised and fixed in 10% neutral buffered formalin for pathological analysis. Representative hematoxylin-eosin (a) and IHC (c) staining for E-cadherin, Vimentin, ZO-1, Slug and TCF are also presented. Bars: 50μm. Expression intensity was calculated as IOD/Area (b). The values presented are the mean ± SD for each group. *P < 0.05, **P < 0.01, ***P < 0.001 (n = 6) vs. the control group, the DOX only group or the MDM2/MDMX inhibitor alone group.
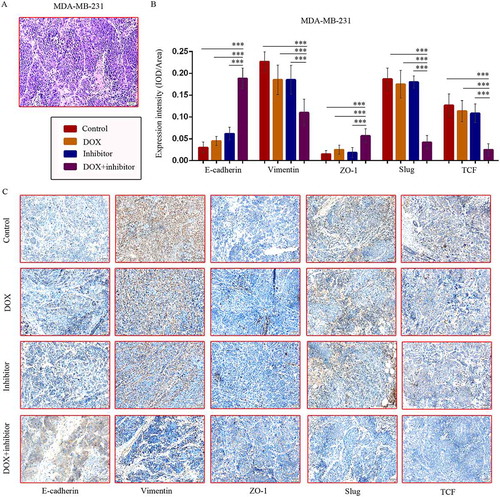
Figure 6. MDM2/MDMX inhibitor in combination with DOX could suppress EMT in TNBC cells. Cells were treated with the indicated agents for 24 h and lysed. The concentrations of each agent were used as follow: DOX 0.29 µM in MDA-MB-231 cells, 5.14 µM in MDA-MB-231/DOX cells, 0.36 µM in MDA-MB-468 cells and 0.22 µM in HCC1937 cells, the MDM2/MDMX inhibitor 33.16 nM in MDA-MB-231 cells, 38.28 nM in MDA-MB-231/DOX cells, 41.49 nM in MDA-MB-468 cells and 36.78 nM in HCC1937 cells. Western blot analysis was performed and confirmed that co-treatment with MDM2/MDMX inhibitor and DOX could suppress EMT in TNBC cells. The representative charts (a, d) and quantified data (b-c, e-f) are shown. *P < 0.05, **P < 0.01, ***P < 0.001 (n = 3) vs. the control group, the DOX group or the MDM2/MDMX inhibitor group. The values presented are indicative of the mean ±SD for each group. GAPDH was used as a loading control.
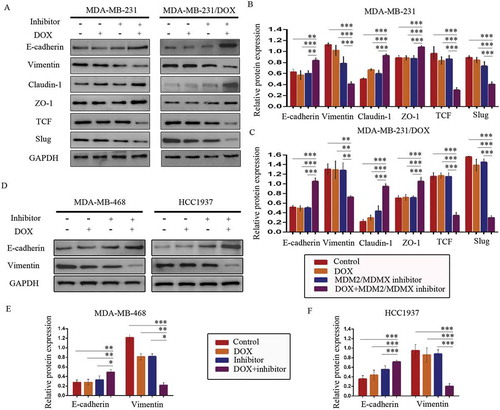
Figure 7. MDM2/MDMX inhibitor in combination with DOX works through activating TAB1/TAK1/p38 MAPK pathway in TNBC cells. Cells were treated with the indicated agents for 24 h and lysed. The concentrations of each agent were used as follow: DOX 5.14 µM in MDA-MB-231/DOX cells, 0.36 µM in MDA-MB-468 cells and 0.22 µM in HCC1937 cells, the MDM2/MDMX inhibitor 38.28 nM in MDA-MB-231/DOX cells, 41.49 nM in MDA-MB-468 cells and 36.78 nM in HCC1937 cells. Western blot analysis was performed and confirmed that co-treatment with MDM2/MDMX inhibitor and DOX could lead to TAB1/TAK1/p38 MAPK overexpression in MDA-MB-231/DOX cells. The representative charts (a) and quantified data (b) are shown. *P < 0.05, **P < 0.01, ***P < 0.001 (n = 3) vs. the control group, the DOX group or the MDM2/MDMX inhibitor group. Cells were transfected with siRNA#1 or siRNA#2 following co-treatment with MDM2/MDMX inhibitor and DOX for 24 hours to detect the effect of TAB1 knockdown by western blot, with appropriate agent dosages at 1:2 (siRNA: Lipofectamine 2000; μg:μg). Western blot analysis of TAB1, TAK1, p38 MAPK, E-cadherin, Vimentin, Claudin-1, ZO-1, TCF and Slug expression including the representative charts (c, f) and the quantified data (d-e, g) are shown. *P < 0.05, **P < 0.01, ***P < 0.001 (n = 3) vs. co-treatment group transfected with siRNA#1 or siRNA#2. The values presented are indicative of the mean ± SD for each group. GAPDH was used as a loading control.
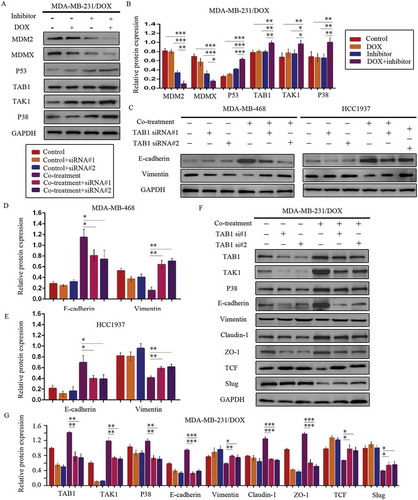
Figure 8. SiRNA-mediated TAB1 knockdown increased invasion ability of TNBC cells. Cells were transfected with siRNA#1 or siRNA#2 following co-treatment with MDM2/MDMX inhibitor and DOX for 24 hours with appropriate agent dosages at 1:2 (siRNA: Lipofectamine 2000; μg:μg). The concentrations of agents were used as follow: DOX 5.14 μM in MDA-MB-231/DOX cells, 0.36 μM in MDA-MB-468 cells and 0.22 μM in HCC1937 cells, the MDM2/MDMX inhibitor 38.28 nM in MDA-MB-231/DOX cells, 41.49 nM in MDA-MB-468 cells and 36.78 nM in HCC1937 cells. Representative images (a) and quantified data (b) of transwell assay are shown. The values presented are the means ± SD for each group. *P < 0.05, **P < 0.01, ***P < 0.001 (n = 3) vs. co-treatment group transfected with siRNA#1 or siRNA#2.
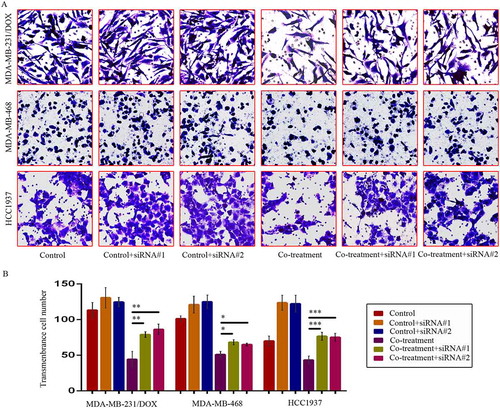
Figure 9. SiRNA-mediated TAB1 knockdown increased migration ability of TNBC cells. Cells were transfected with siRNA#1 or siRNA#2 following co-treatment with MDM2/MDMX inhibitor and DOX for 24 hours with appropriate agent dosages at 1:2 (siRNA: Lipofectamine 2000; μg:μg). The concentrations of agents were used as follow: DOX 5.14 μM in MDA-MB-231/DOX cells, 0.36 μM in MDA-MB-468 cells and 0.22 μM in HCC1937 cells, the MDM2/MDMX inhibitor 38.28 nM in MDA-MB-231/DOX cells, 41.49 nM in MDA-MB-468 cells and 36.78 nM in HCC1937 cells. Representative images (a) and quantified data (b) of wound healing assay are shown. The values presented are the means ± SD for each group. *P < 0.05, **P < 0.01, ***P < 0.001 (n = 3) vs. co-treatment group transfected with siRNA#1 or siRNA#2.
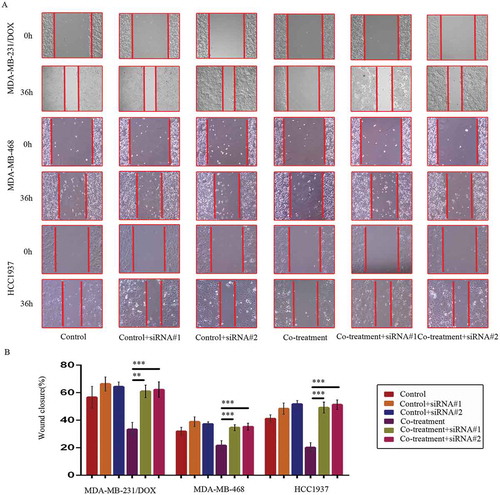
Table 1. Associations between MDM2/MDMX expression and the clinicopathological characteristics of 214 TNBC patients.
Figure 10. Clinical significance of MDM2/MDMX/TAB1 expression in TNBC tissues. (a) Representative IHC staining for MDM2/MDMX/TAB1 expression in TNBC tissues. Bars: 50μm. (b) Kaplan-Meier survival curves for MDM2/MDMX/TAB1 expression in 214 TNBC patients. Mutual regulations between the molecules are shown (c).
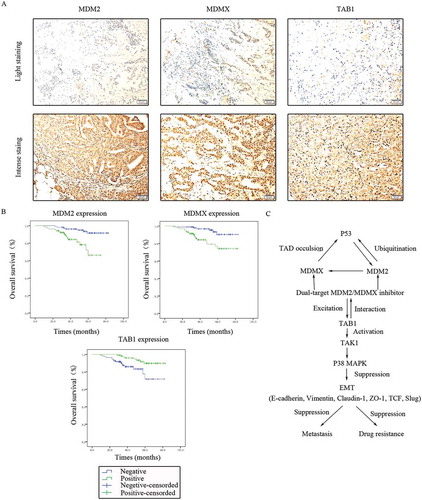
Table 2. Univariate analysis of TNBC patient prognosis (n = 214).
Table 3. Multivariate analysis of TNBC patient prognosis (n = 214).
Table 4. Associations between MDM2/MDMX and TAB1 expression in 214 TNBC tissues.