Figures & data
Figure 1. CT scan of the abdomen and pelvis showing large mass in the head of pancreas with multiple hypodense lesions in the liver in (a) axial view and (b) coronal view (arrows).
Figure 2. Histochemical findings of metastatic lesions of the liver: (a) low power view (H and E stain, original magnification of 100X) of showing tumor clusters on the left and hepatic tissue on the right with no evidence of glandular differentiation (b) high power view (H and E stain, original magnification of 400x) showing nests of tumor cells. (c) very high-power view (H and E stain, original magnification of 600x) showing tumor cells with intercellular bridges (a sign of squamous differentiation), variably sized hyperchromatic nuclei and small nucleoli. (d) high power view (Immunohistochemical staining, original magnification of 400x) showing positive nuclear staining with p40 showing squamous differentiation.
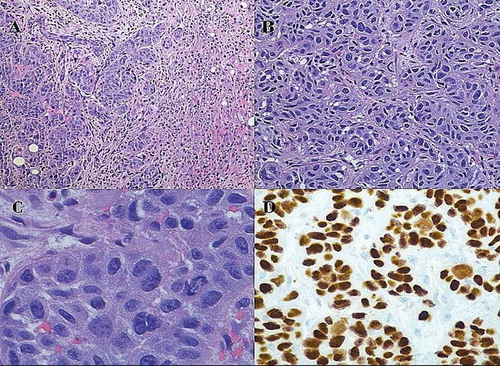
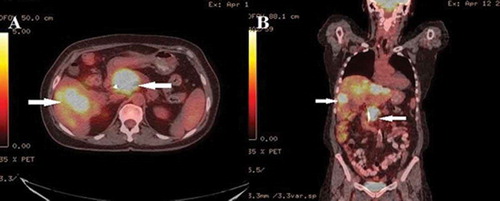
Figure 3. PET-CT scan showing large hypermetabolic lesion in the head of pancreas, multiple hypermetabolic hepatic lesions and one hypermetabolic right retroperitoneal lymph node in (a) axial view and (b) coronal view (arrows).