Figures & data
Table 1. Sequences of primers used for quantitative real-time PCR assays.
Figure 1. The physicochemical parameters of curcumin liposome. (A) The morphology of curcumin liposome detected by transmission electron microscopy (TEM). (B) HPLC chromatographic peak of curcumin. 1: bisdemethyoxy cuecumin; 2: demethoxy cuecumin; 3: cuecumin. (C) Particle size distribution of liposomal curcumin. (D) Zeta potential of liposomal curcumin.
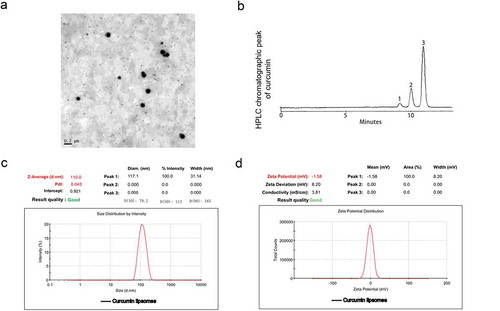
Figure 2. Curcumin liposome inhibited the expression of HIF-1α and survivin in hypoxic cells. (A) The cell viabilities in each group. (B) Curcumin liposome inhibited the mRNA expression of HIF-1α and survivin. (C) The protein levels of HIF-1α and survivin by Western blot. (D) Curcumin liposome inhibited the protein levels of HIF-1α and survivin. *P < 0.05,**P < 0.01 versus control group, #P < 0.05, ##P < 0.01 versus hypoxia group, &P < 0.05, &&P < 0.01 versus cur+ hypoxia group.
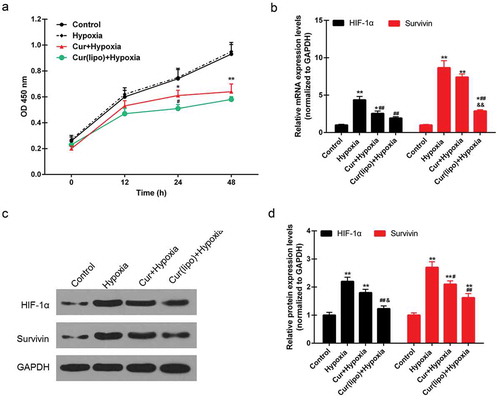
Figure 3. Effect of cuecumin liposome on the apoptosis and cell cycle in HepG2 cells. (A) The apoptosis rate of HepG2 cells in the four groups. (B) The histogram showed the apoptosis percentage of HepG2 cells. (C) Cell cycle analysis by a flow cytometry. (D) The increased cells accumulated in G1 phase. *P < 0.05, **P < 0.01 versus control group, #P < 0.05, ##P < 0.01 versus hypoxia group, &P < 0.05, &&P < 0.01 versus cur+ hypoxia group.
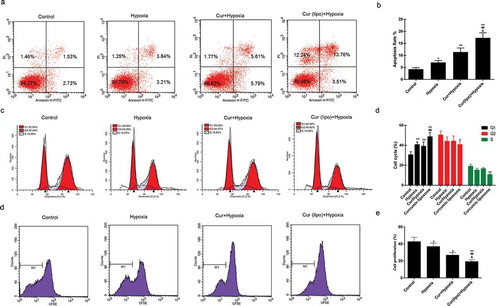
Figure 4. Effect of curcumin liposome on the expression of proliferation- and apoptosis-related molecules. (A-D) The mRNA and protein levels of VEGF, Bcl-2, caspase-3 and Bax. (E-F) The mRNA and protein levels of p21 and cyclin D1. (G) The protein expressions of VEGF, Bcl-2, caspase-3, Bax, p21 and cyclin D1 was detected by Western blot. **P < 0.01 versus control group, ##P < 0.01 versus hypoxia group, &P < 0.05, &&P < 0.01 versus cur+ hypoxia group.
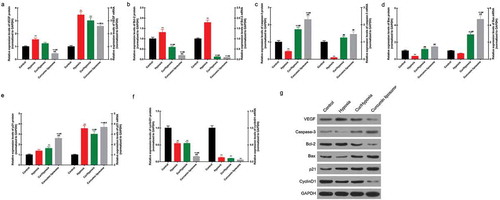
Figure 5. Curcumin liposome suppressed the tumor growth. (A) Establishment of VX2 rabbit hepatic cancer models. (B) The MRI images of the tumor size. (C) H&E staining of liver tumor tissues in VX2 rabbits. Scale bar, 20 μm. (D) The tumor volume was calculated by MRI imaging. **P < 0.01 versus Saline group, ##P < 0.01 versus lipiodol group.
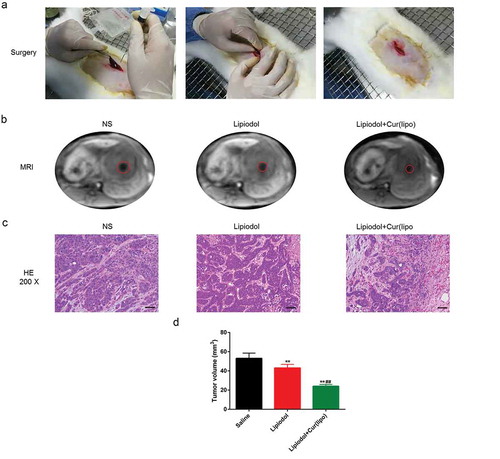
Figure 6. Curcumin liposome alleviated the angiogenesis and promoted the tumor apoptosis. (A) IHC staining of the CD31. Scale bar, 20 μm. Arrows point to microvessels. (B) The MVDs in each group. (C) IHC staining of the VEGF. Scale bar, 20 μm. (D) Changes in VEGF expression. (E) TUNEL was performed to detect the apoptosis of xenografts tissues. Scale bar, 20 μm. (F) The apoptosis percentage of xenografts tissues. **P < 0.01 versus saline group, ##P < 0.01 versus lipiodol group.
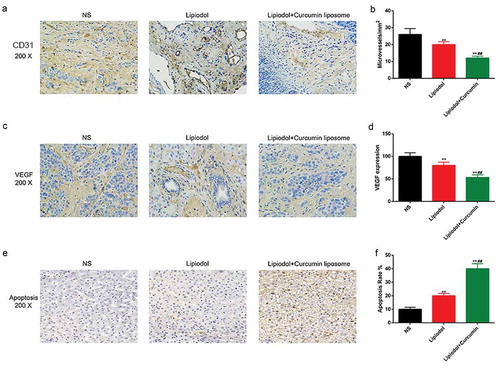
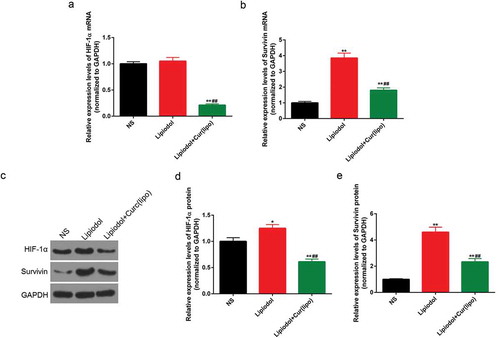
Figure 7. Curcumin liposome reduced the levels of HIF-1α and survivin in vivo. (A-B) The mRNA levels of HIF-1α and surviving. (C) The protein levels of HIF-1α and survivin by Western blot. (D-E) The protein levels of HIF-1α and survivin. *P < 0.05, **P < 0.01 versus saline group, ##P < 0.01 versus lipiodol group.