Figures & data
Figure 1. RMRP expression was upregulated in neonatal neuroblastoma tissues, and upregulated RMRP was positively associated with aggressive pathological status and poor prognosis of neonatal neuroblastoma patients. (a-c) RT-qPCR assay was performed to measure RMRP expression in neonatal neuroblastoma tissues (Tumor, n = 44) and corresponding adjacent normal tissues (Normal, n = 44) (a and b), neonatal neuroblastoma tissues in different pathological stages (c, n (I+ II) = 10, n (III+ IV) = 34). (d) Kaplan Meier analysis of cumulative survival for neonatal neuroblastoma patients referring to the difference of RMRP level. *P < 0.05.
Figure 2. Knockdown of RMRP curbed proliferation, migration and invasion of neuroblastoma cells. (a and b) NB-1 and SK-N-AS cells were transfected with Scrambled control, siRMRP#1 or siRMRP#2, followed by the detection of RMRP level using RT-qPCR assay at 48 h after transfection. (c-g) NB-1 and SK-N-AS cells were transfected with Scrambled control or siRMRP#2. (c and d) At the indicated time points (0, 24, 48, 72 h) after transfection, the effect of RMRP silence on cell proliferation was measured by CCK-8 assay. (e) At 2 weeks post transfection, cell colony number was determined by colony formation assay. (f and g) At 48 h upon transfection, migratory and invasive cell number was detected by Transwell migration and invasion assays, respectively. *P < 0.05.
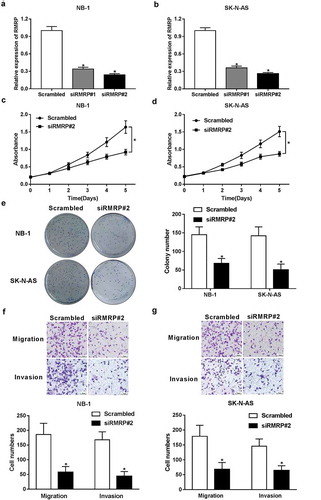
Figure 3. RMRP acted as a molecular sponge of miR-206 in neuroblastoma cells. (a) Expression pattern of miR-206 in 44 pairs of neonatal neuroblastoma tissues and adjacent normal tissues. (b) Correlation analysis of miR-206 and RMRP in neuroblastoma tissues (n = 44). (c) Putative binding sites between miR-206 and RMRP, and mutant sites in RMRP-Mut reporter. (d) NB-1 and SK-N-AS cells were transfected with miR-206 mimic or its scramble control (NC), followed by the examination of miR-206 level at 48 h after transfection. (e and f) NB-1 and SK-N-AS cells were co-transfected with RMRP-Wt or RMRP-Mut reporter and miR-206 mimic or its scramble control (NC). At 48 h post transfection, relative luciferase activity was detected. (g) NB-1 and SK-N-AS cells were transfected with, miR-206 mimic, miR-206 inhibitor, or their matching controls, followed by the measurement of RMRP level using RT-qPCR assay at 48 h upon transfection. (h) NB-1 and SK-N-AS cells were transfected with scramble control (Scrambled), siRMRP#2, pcDNA3.1 empty vector or pcDNA3.1-RMRP overexpression plasmid. Then, miR-206 level was determined by RT-qPCR assay at 48 h post transfection. *P < 0.05.
Figure 4. RMRP enhanced TACR1 expression by performing as a ceRNA of miR-206 in neuroblastoma cells. (a) Predicted binding sites between TACR1 3ʹUTR and miR-206, and mutant sites in TACR1-Mut reporter. (b and c) NB-1 and SK-N-AS cells with the transfection of TACR1-WT or TACR1-Mut reporter were also transfected with a scramble control (NC) of miR-206, miR-206 mimic, miR-206 mimic+ pcDNA3.1 or miR-206 mimic+ pcDNA3.1-RMRP, followed by the detection of luciferase activity at 48 h after transfection. (d-g) NB-1 and SK-N-AS cells were transfected with NC, miR-206 mimic, miR-206 mimic+ pcDNA3.1, miR-206+ pcDNA3.1-RMRP, scramble control of siRMRP (Scrambled), siRMRP#2, siRMRP#2+ miR-NC inhibitor, or siRMRP#2+ miR-206 inhibitor. At 48 h upon transfection, TACR1 expression at mRNA (d and e) and protein (f and g) levels was determined by RT-qPCR and western blot assays, respectively. *P < 0.05.
Figure 5. TACR1 upregulation abolished RMRP silence-mediated inhibitory effect on cell progression by activating ERK1/2 signal in neuroblastoma cells. (a-f) NB-1 and SK-N-AS cells were transfected with Scrambled control of siRMRP, siRMRP#2, siRMRP#2+ pcDNA3.1 or siRMRP#2+ pcDNA3.1-TACR1, followed by the measurement of cell proliferative capacity (a and b), colony formation number (c), cell migration and invasion number (d), and protein levels of p-ERK1/2 and ERK1/2 (E and F). *P < 0.05.
Figure 6. Inhibition of TACR1 and ERK1/2 signal abated RMRP-mediated pro-proliferation effect in neuroblastoma cells. (a and b) NB-1 and SK-N-AS cells were transfected with pcDNA3.1 or pcDNA3.1-RMRP for 24 h, and then cultured for another 48 h in the presence or absence of DMSO (Control) or Fosaprepitant (10 μM or 20 μM), followed by the determination of cell proliferative capacity using CCK-8 assay. (C and D) NB-1 and SK-N-AS cells were transfected with pcDNA3.1 or pcDNA3.1-RMRP for 24 h, and then cultured for additional 48 h in the presence or absence of DMSO (Control) or PD98059 (10 μM), followed by the measurement of cell proliferative ability using CCK-8 assay. *P < 0.05.
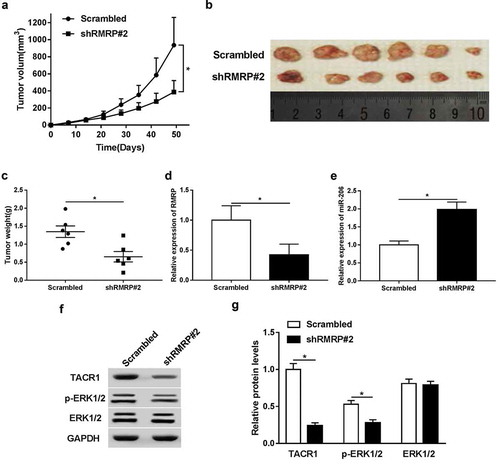
Figure 7. The depletion of RMRP hindered neuroblastoma xenograft tumor growth by regulating miR-206/TACR1 axis via inactivating ERK1/2 signal in vivo. shRNRP#2 or Scrambled stably-transfected SK-N-AS cells were injected into null mice to construct mouse xenograft models of neuroblastoma with or without RMRP knockdown, respectively. (a) Tumor volumes were monitored every 7 days for total 49 days after injection. (b and c) At the end of experiments, excised tumors were imaged (b) and weighted (c). (d and e) Expression of RMRP and miR-206 in resected tumors was determined by RT-qPCR assay. (f and g) Protein levels of TACR1, p-ERK1/2 and ERK1/2 were detected using western blot assay. *P < 0.05.