
Figures & data
Figure 1. Neratinib and entinostat interact to kill uveal melanoma cells. (a). Images of four PDX isolates of human uveal melanoma cells and of one established uveal melanoma cell line. (b). Uveal melanoma cells were treated for 12h or 24h with vehicle control, neratinib (100 nM), entinostat (50 nM) or the drugs in combination. At each time point, the cells were isolated, and viability determined via trypan blue exclusion assays (n = 3 ± SD).
Figure 2. Neratinib, entinostat and the drug combination reduce the protein levels of Gαq and Gα11. (a). Uveal melanoma cells were treated for 6h with vehicle control, entinostat (50 nM), neratinib (100 nM) or the drugs in combination. Cells were fixed in place and immune-staining performed to detect the total expression of Gαq and Gα11. Analyses for densitometric scanning of fluorescence intensity were performed at 10X magnification on > 120 cells per condition (n = 3 ± SD) * p < 0.05 less than exposure to either neratinib or entinostat; images of PDX4 are representative, and at 60X magnification. (b). Additional images from studies in Panel A for isolate PDX2. (c). Uveal melanoma cells were treated for 6h with vehicle control, entinostat (50 nM), neratinib (100 nM) or the drugs in combination. Cells were fixed in place and immune-staining performed to detect the total expression of ERBB1. Analyses for densitometric scanning of fluorescence intensity were performed at 10X magnification on > 120 cells per condition (n = 3 ± SD).
Figure 3. Neratinib causes the rapid formation of intracellular vesicles that stain for K-RAS V12-GFP and K-RAS V12-RFP. (a). PANC-1 pancreatic and HCT116 colorectal tumor cells were transfected with plasmids to express K-RAS V12-GFP and K-RAS V12-RFP. Twenty-four h after transfection cells were treated with vehicle control or with neratinib (100 nM). Cells were imaged at 60X magnification over the time course shown in the Figure (representative images from three studies are shown). (b). Additional studies were performed in an identical fashion to Panel A. Cells were imaged at 30 min and after 8h at 60X magnification representative images from three studies are shown). (c). PANC-1 pancreatic and HCT116 colorectal tumor cells were treated with vehicle control or with neratinib (100 nM) for 6h. Cells were fixed and stained to determine the phosphorylation and expression of ERBB1, ERBB2 and ERBB3. Analyses for densitometric scanning of fluorescence intensity at 3h were performed at 10X magnification on > 120 cells per condition (n = 3 ± SD) * p < 0.05 less than vehicle control exposure.
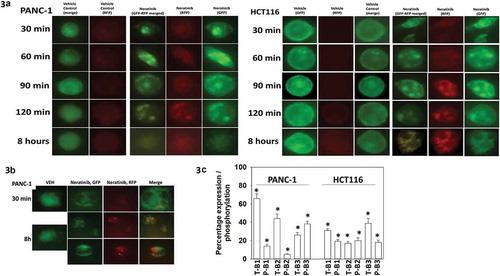
Figure 4. Degradation of K-RAS requires autophagosome formation. (a). PANC-1 pancreatic and HCT116 colorectal tumor cells were transfected with plasmids to express K-RAS V12-GFP and K-RAS V12-RFP. In parallel, cells were transfected with a scrambled siRNA control or with siRNA molecules to knock down the expression of ATG5, Beclin1 or LAMP2. Twenty-four h after transfection cells were treated with vehicle control or with neratinib (100 nM). Cells were imaged at 60X magnification over the time course shown in the Figure (representative images from three studies are shown). Analyses for densitometric scanning of fluorescence intensity at 3h were performed at 10X magnification on > 120 cells per condition (n = 3 ± SD) * p < 0.05 less than vehicle control exposure. (b). PANC-1 and HCT116 cells were transfected with a scrambled control or with siRNA molecules to knock down the expression of K-RAS or N-RAS. Twenty-four h after transfection, cells were fixed in place and immune-staining performed to detect the fluorescence intensity under each condition. Analyses for densitometric scanning of fluorescence intensity at 3h were performed at 10X magnification on > 120 cells per condition (n = 3 ± SD) * p < 0.05 less than vehicle control exposure. (c). Uveal melanoma cells were transfected with a scrambled siRNA control or with siRNA molecules to knock down the expression of ATG5 or Beclin1. Twenty-four h after transfection cells were treated with vehicle control or with neratinib (100 nM). Cells were imaged at 60X magnification over the time course shown in the Figure (representative images from three studies are shown). Analyses for densitometric scanning of fluorescence intensity at 3h were performed at 10X magnification on > 120 cells per condition (n = 3 ± SD) * p < 0.05 less than vehicle control exposure; ** p < 0.01 less than vehicle control exposure.
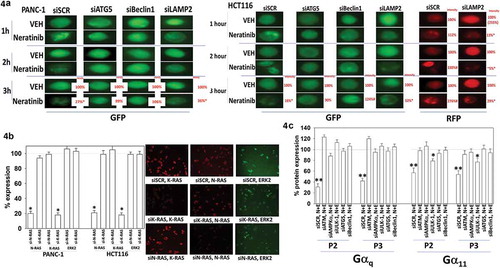
Figure 5. Neratinib and entinostat combine to activate autophagy, down-regulate cyto-protective signaling and promote mitochondrial dysfunction. PDX2 and PDX3 uveal melanoma cells were treated for 8h with vehicle control, neratinib (100 nM), entinostat (50 nM) or the drugs in combination. Cells were fixed in place and immune-staining performed to detect the fluorescence intensity for each antibody/biomarker under each condition. Analyses for densitometric scanning of fluorescence intensity at 8h were performed at 10X magnification on > 120 cells per condition (n = 3 ± SD) * p < 0.05 less than entinostat or neratinib exposure in PDX2 AND PDX3; * p < 0.05 greater than entinostat or neratinib exposure in PDX2 AND PDX3.
Figure 6. [Neratinib + entinostat] lethality requires expression of eIF2α and CD95 and is enhanced by knock down of protective mitochondrial proteins. PDX2 and PDX3 uveal melanoma cells were transfected with an empty vector plasmid (CMV) or to express c-FLIP-s, BCL-XL or dominant negative caspase 9, or alternatively were transfected with a scrambled siRNA or with siRNA molecules to knock down the expression of the proteins indicated in each graph. Twenty-four h after transfection, cells were treated with vehicle control, neratinib (100 nM), entinostat (50 nM) or the drugs in combination for 12h. At each time point, the cells were isolated, and viability determined via trypan blue exclusion assays (n = 3 ± SD). * p < 0.05 less than corresponding value in CMV/SCR transfected cells; ** p 0.01 less than corresponding value in CMV/SCR transfected cells; # p < 0.05 greater than corresponding value in CMV/SCR transfected cells.
![Figure 6. [Neratinib + entinostat] lethality requires expression of eIF2α and CD95 and is enhanced by knock down of protective mitochondrial proteins. PDX2 and PDX3 uveal melanoma cells were transfected with an empty vector plasmid (CMV) or to express c-FLIP-s, BCL-XL or dominant negative caspase 9, or alternatively were transfected with a scrambled siRNA or with siRNA molecules to knock down the expression of the proteins indicated in each graph. Twenty-four h after transfection, cells were treated with vehicle control, neratinib (100 nM), entinostat (50 nM) or the drugs in combination for 12h. At each time point, the cells were isolated, and viability determined via trypan blue exclusion assays (n = 3 ± SD). * p < 0.05 less than corresponding value in CMV/SCR transfected cells; ** p 0.01 less than corresponding value in CMV/SCR transfected cells; # p < 0.05 greater than corresponding value in CMV/SCR transfected cells.](/cms/asset/0f0fd427-1671-423b-b2b6-fe4ab14b7f0c/kcbt_a_1551747_f0006_b.gif)
Figure 7. Expression of activated mTOR suppresses activation of autophagy signaling and maintains MCL-1 and BCL-XL expression but does not alter AKT inactivation. (a) & (b). PDX2 uveal melanoma cells were transfected with an empty vector plasmid (CMV) or a plasmid to express an activated mutant form of mTOR. Twenty-four h after transfection cells were treated with vehicle control or with [neratinib (100 nM) + entinostat (50 nM)] for 8h. Cells were fixed in place and immune-staining performed to detect the fluorescence intensity for each antibody/biomarker under each condition. Analyses for densitometric scanning of fluorescence intensity at 8h were performed at 10X magnification on > 120 cells per condition (n = 3 ± SD). (c). Uveal melanoma cells were transfected with an empty vector plasmid or with plasmids to express constitutively active AKT, active mTOR or active STAT3. Twenty-four h after transfection cells were treated with vehicle control or with [neratinib (100 nM) + entinostat (50 nM)] for 24h. Cells were isolated, and viability determined via trypan blue exclusion assays (n = 3 ± SD). * p < 0.05 less than corresponding value in CMV transfected cells. (d–f). Uveal melanoma cells were treated with vehicle control or with [neratinib (100 nM) + entinostat (50 nM)] for 6h and 12h. Cells were fixed in place and immune-staining performed to detect the fluorescence intensity for each antibody/biomarker under each condition. Analyses for densitometric scanning of fluorescence intensity were performed at 10X magnification on > 120 cells per condition (n = 3 ± SD).
![Figure 7. Expression of activated mTOR suppresses activation of autophagy signaling and maintains MCL-1 and BCL-XL expression but does not alter AKT inactivation. (a) & (b). PDX2 uveal melanoma cells were transfected with an empty vector plasmid (CMV) or a plasmid to express an activated mutant form of mTOR. Twenty-four h after transfection cells were treated with vehicle control or with [neratinib (100 nM) + entinostat (50 nM)] for 8h. Cells were fixed in place and immune-staining performed to detect the fluorescence intensity for each antibody/biomarker under each condition. Analyses for densitometric scanning of fluorescence intensity at 8h were performed at 10X magnification on > 120 cells per condition (n = 3 ± SD). (c). Uveal melanoma cells were transfected with an empty vector plasmid or with plasmids to express constitutively active AKT, active mTOR or active STAT3. Twenty-four h after transfection cells were treated with vehicle control or with [neratinib (100 nM) + entinostat (50 nM)] for 24h. Cells were isolated, and viability determined via trypan blue exclusion assays (n = 3 ± SD). * p < 0.05 less than corresponding value in CMV transfected cells. (d–f). Uveal melanoma cells were treated with vehicle control or with [neratinib (100 nM) + entinostat (50 nM)] for 6h and 12h. Cells were fixed in place and immune-staining performed to detect the fluorescence intensity for each antibody/biomarker under each condition. Analyses for densitometric scanning of fluorescence intensity were performed at 10X magnification on > 120 cells per condition (n = 3 ± SD).](/cms/asset/462d80db-1a85-4d6f-8a27-f4297a4b5229/kcbt_a_1551747_f0007_b.gif)
Figure 8. Neratinib and entinostat interact to increase reactive oxygen species production that is required for ATM-AMPK activation. (a). Uveal melanoma cells were treated with vehicle control or with [neratinib (100 nM) + entinostat (50 nM)] for 2h, 4h, 6h and 8h. At each time point, cells were incubated with DCFH-DA (5 μM) for 10 min, and then the fluorescence measured in a plate reader. (n = 3 ± SD) # p < 0.05 greater than corresponding entinostat alone value. (b). Uveal melanoma cells were transfected with an empty vector plasmid (CMV), a plasmid to express thioredoxin (TRX), a plasmid to express superoxide dismutase 2 (SOD2) or both proteins together. Twenty-four h after transfection, cells were treated with vehicle control or with [neratinib (100 nM) + entinostat (50 nM)] for 24h. Cells were then isolated, and viability determined via trypan blue exclusion assays (n = 3 ± SD). (c). Uveal melanoma cells were transfected with an empty vector plasmid (CMV) or with plasmids to express thioredoxin (TRX) and superoxide dismutase 2 (SOD2). Twenty-four h after transfection, cells were treated with vehicle control or with [neratinib (100 nM) + entinostat (50 nM)] for 2h, 4h, 6h and 8h. At each time point, cells were incubated with DCFH-DA (5 μM) for 10 min, and then the fluorescence measured in a plate reader. (n = 3 ± SD) * p < 0.05 less than corresponding value in CMV transfected cells. (d). Uveal melanoma cells were transfected with an empty vector plasmid or with plasmids to express TRX and SOD2. Twenty-four h after transfection, cells were treated with vehicle control or with [neratinib (100 nM) + entinostat (50 nM)] for 4h and 8h. Cells were fixed in place and immune-staining performed to detect the fluorescence intensity for each antibody/biomarker under each condition. Analyses for densitometric scanning of fluorescence intensity were performed at 10X magnification on > 120 cells per condition (n = 3 ± SD) * p < 0.05 less than corresponding value in CMV transfected cells.
![Figure 8. Neratinib and entinostat interact to increase reactive oxygen species production that is required for ATM-AMPK activation. (a). Uveal melanoma cells were treated with vehicle control or with [neratinib (100 nM) + entinostat (50 nM)] for 2h, 4h, 6h and 8h. At each time point, cells were incubated with DCFH-DA (5 μM) for 10 min, and then the fluorescence measured in a plate reader. (n = 3 ± SD) # p < 0.05 greater than corresponding entinostat alone value. (b). Uveal melanoma cells were transfected with an empty vector plasmid (CMV), a plasmid to express thioredoxin (TRX), a plasmid to express superoxide dismutase 2 (SOD2) or both proteins together. Twenty-four h after transfection, cells were treated with vehicle control or with [neratinib (100 nM) + entinostat (50 nM)] for 24h. Cells were then isolated, and viability determined via trypan blue exclusion assays (n = 3 ± SD). (c). Uveal melanoma cells were transfected with an empty vector plasmid (CMV) or with plasmids to express thioredoxin (TRX) and superoxide dismutase 2 (SOD2). Twenty-four h after transfection, cells were treated with vehicle control or with [neratinib (100 nM) + entinostat (50 nM)] for 2h, 4h, 6h and 8h. At each time point, cells were incubated with DCFH-DA (5 μM) for 10 min, and then the fluorescence measured in a plate reader. (n = 3 ± SD) * p < 0.05 less than corresponding value in CMV transfected cells. (d). Uveal melanoma cells were transfected with an empty vector plasmid or with plasmids to express TRX and SOD2. Twenty-four h after transfection, cells were treated with vehicle control or with [neratinib (100 nM) + entinostat (50 nM)] for 4h and 8h. Cells were fixed in place and immune-staining performed to detect the fluorescence intensity for each antibody/biomarker under each condition. Analyses for densitometric scanning of fluorescence intensity were performed at 10X magnification on > 120 cells per condition (n = 3 ± SD) * p < 0.05 less than corresponding value in CMV transfected cells.](/cms/asset/6d720349-d924-4272-b64a-f01526c62ef2/kcbt_a_1551747_f0008_oc.jpg)