Figures & data
Figure 1. A1 peptide promoted the differentiation of DCs. (a). FCM analysis of CD80 and CD83 expression after 7 days in culture on DC, Ag-DC cells, A1-DC cells. (b). The quantification of CD80 and CD83 expression from the FCM data was given as mean ± SEM from three independent experiments. **P < 0.01, ***P < 0.001.
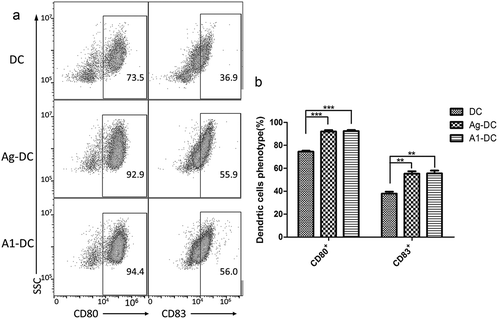
Figure 2. A1 peptide-treated DCs could enhance the differentiation and cytotoxicity of CIK cells. (a). CIK cells cultured on 14 day were collected and incubated with CD3-FITC, CD8-APC and CD56-PE antibodies. The phenotypes of these cells were analyzed by FCM as described in Materials and methods. The figure showed the FCM data for the CD3+CD8+ and CD3+CD56+ expression after 14 days in culture on CIK, DC-CIK, Ag-DC-CIK and A1-DC-CIK. (b). The quantification of CD3+CD8+ and CD3+CD56+ expression from the FCM data was given as mean ± SEM from three independent experiments. *P < 0.05.
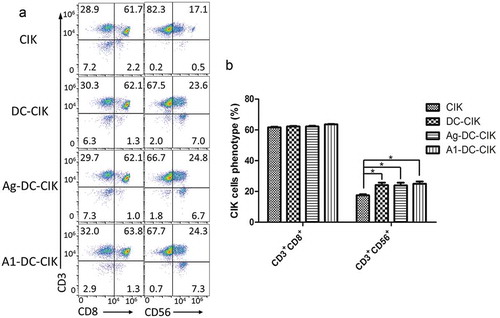
Figure 3. Co-culturing of A1 peptide-treated-DC with CIK cells induced the production of memory T lymphocytes and down-regulation of co-inhibitory molecules. A. FCM analysis of CD62L and PD-1 expression after 14 days culture. B. The quantification of CD62L and PD-1 expression. Data were given as mean ± SEM from three independent experiments. *P<0.05, **P<0.01.
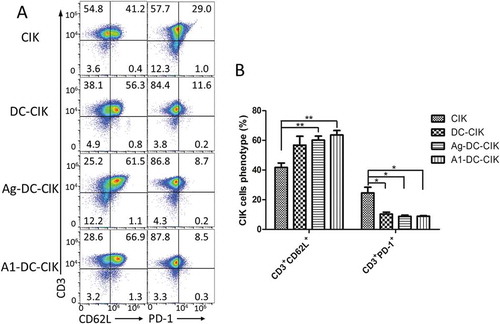
Figure 4. A1 peptide-treated-DC-CIK cells exhibited specific cytotoxicity on A549 cells coated with A1 peptides in vitro.CIK, DC-CIK, Ag-DC-CIK or A1-DC-CIK effector cells were cultured for 14 days. The resulting effector cell populations were used to examine cytotoxicity on MDA-MB-231 and A549 cells. The target cells were incubated with A1 polypeptide (50 μg/mL) for an hour before mixed with the effector cells. The cytotoxicity of the effector cells against target cells was examined with CCK8 kit. (a). MDA-MB-231 cells were incubated with effector cells for 24 hour at effector-to-target (E: T) ratios of 20:1. (b). A549 cells were incubated for 24 hour with effector cells at E: T ratios of 20:1. Data were given as mean ± SEM from three independent experiments. *P < 0.05, **P < 0.01, ***P < 0.001.
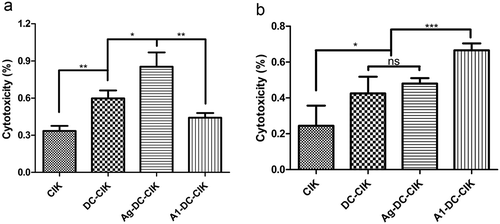
Figure 5. A1 peptide-treated-DC-CIK cells could inhibit the tumor growth in a xenografts mouse models. (a). Representatives bioluminescence images of tumor-bearing mice in each group. (b). Three weeks after cell therapy, the record of bioluminescent signal changes of tumor mass for each group were compared. *P < 0.05. (c). The record of tumor volume changes of each group treated mice. *P < 0.05. (d). IFN-γ and GZMB immune staining images of tumor tissues from A1-DC-CIK, Ag-DC-CIK, DC-CIK and PBS groups. E. Immunohistochemical quantitative analysis of IFN-γand GZMB in D. Data were given as mean ± SEM from three independent experiments. *P < 0.05, **P < 0.01, ***P < 0.001.
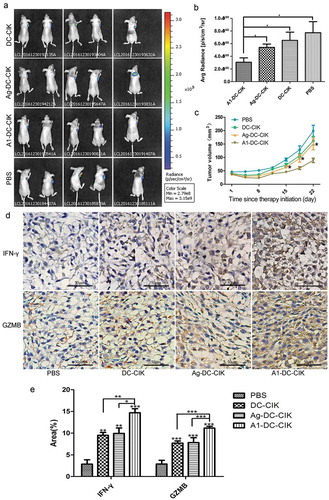
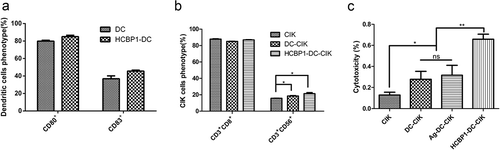
Figure 6. HCBP1 peptide-treated-DC-CIK cells had specific cytotoxicity on H460 sphere cells coated with HCBP1 peptides in vitro. (a). The quantification of CD80 and CD83 expression of DCs, HCBP1-DC cells for 7 days in culture is given as mean ± SEM from three independent experiments. (b). The quantification of CD3+CD8+ and CD3+CD56+ expression of CIK, DC-CIK and HCBP1-DC-CIK for 14 days in culture are given as mean ± SEM from three independent experiments. *P < 0.05. C. H460 sphere cells were incubated with CIK, DC-CIK, Ag-DC-CIK or HCBP1-DC-CIK cells for 24 h at E: T ratios of 20:1. The target cells were incubated with HCBP1 polypeptide (50 μg/mL) for an hour before mixed with the effector cells. Data were given as mean ± SEM from three independent experiments. *P < 0.05, **P < 0.01.