Figures & data
Figure 1. (a) Photo of the Cu-Cy NPs in aqueous solution, under a normal light source (left) and ultraviolet light (right), (b) the TEM image, (c) and the excitation and emission spectra of Cu-Cy NPs; the excitation wavelength is 360 nm and the emission wavelength is 600 nm.
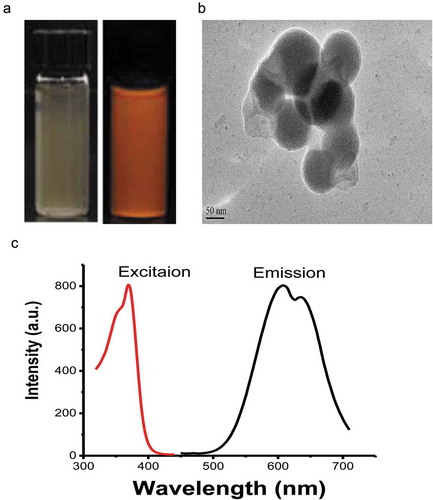
Figure 2. The generation of singlet oxygen, determination of UV dosage and the concentration of Cu-Cy NPs. (a) RNO absorption quenching indicates singlet oxygen production in control (RNO) and Cu-Cy NPs using UV light (365 nm). The data are expressed as the mean ± SD of three independent experiments. *P< 0.05 and **P< 0.005 compared with the control. (b) The viability of HepG2 cells treated with UV light at the indicated times for 24 h was determined using an MTT assay (0 min as control). The results are presented as the mean ± SD in triplicate from one experiment. *P < 0.05 and **P < 0.005 compared with the control. (c) The viability of HepG2 cells treated with Cu-Cy NPs at the indicated concentrations for 24 h was determined using an MTT assay (0 μg/ml as control). The data are expressed as the mean ± SD of three independent experiments. *P < 0.05 and **P < 0.005 compared with the control.
Figure 3. (a) Images of HepG2 cells incubated for 5 min, 60 min, and 240 min with Cu-Cy NPs. As shown in picture 5 min, no cell uptake of Cu-Cy NPs, 60 min, and 240 min had varying degrees of binding. (b) The proportion of Cu-Cy NPs adhered by cells in different incubation time. The data are expressed as the mean ± SD of three independent experiments, a P < 0.05 compared with 5 min group, b P < 0.05 compared with 60 min group. (c) The viability of HepG2 cells at different binding degree of Cu-Cy NPs without UV light in 24 h was determined using an MTT assay. The data are expressed as the mean ± SD of three independent experiments.
Figure 4. Destruction of HepG2 cells by Cu-Cy NPs (25 μg/ml) under different binding degree after UV irradiation. (a) Images of fluorescence staining show HepG2 live (green, calcein stain) and dead (red, EthD-1 stain) cells. Pictures (5 min), (60 min), and (240 min) show the damage of Cu-Cy NPs to cells in different binding degree (incubated with Cu-Cy NPs for 5 min, 60 min, and 240 min, respectively). (b) The proportion of dead and living cells in different incubation time after UV radiation. The data are expressed as the mean ± SD of three random pictures. a P < 0.05 compared with control. (c) The viability of HepG2 cells at the same binding degree of Cu-Cy NPs with UV light in 24 h was determined using an MTT assay. a P < 0.05 compared with control. The data are expressed as the mean ± SD of three independent experiments.
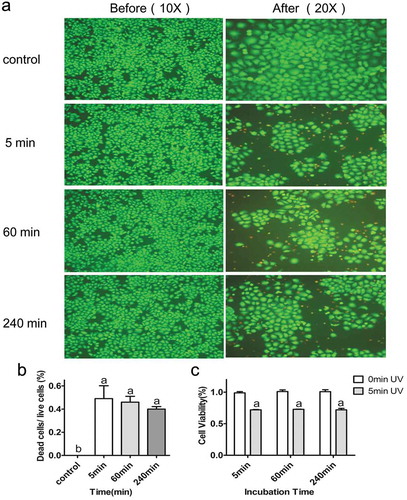
Figure 5. Comparison of Cu-Cy NPs and 5-FU induced HepG2 cells apoptosis. (a) Cell apoptosis profiles were measured by flow cytometry following treatment of different groups with the concentration of 25 μg/ml for 24 h. (b) Cellular consequence was quantified by apoptosis. The data are expressed as the mean ± SD of three independent experiments. a P < 0.05 compared with control, b P < 0.05 compared with 5-FU group, c P < 0.05 compared with Cu-Cy NPs group, and d P < 0.05 compared with Cu-Cy NPs+UV group. (c) The expression levels of the proteins including cleaved-caspase 3 and cleaved-PARP in HepG2 cells.
Figure 6. The expression levels of the proteins including cleaved-PARP in HepG2 cells.
Figure 7. Establishment of a tumor model. (a) The process and grouping of an experiment in nude mice. (b) Images of nude mice with different sized HepG2 tumors after different treatment. The left leg of each mouse is the control. (c) HE staining of HepG2 tumor in mice.
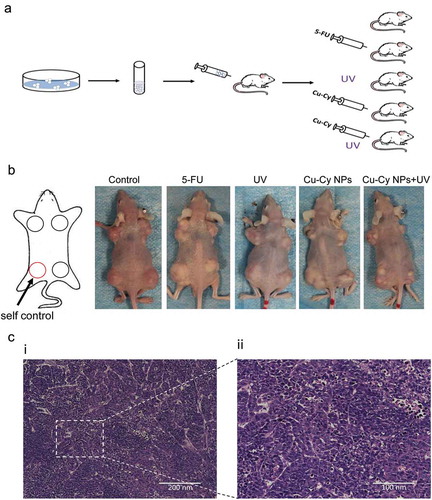
Figure 8. Images of tumors sized after treatment. (a) Image of the growth curve of tumor in different groups of mice. The results are presented as the mean of eight mice per group from the experiment. *P < 0.05 Cu-Cy NPs+UV compared with the control, +P < 0.05 5-FU compared with the control. (b) Images of tumor size in the different group after different treatment. (c) Scatter plots of tumor volume after treatment with different groups of mice. The results are presented as the mean ± SD of eight mice per group from the experiment. *P < 0.05 compared with the control.
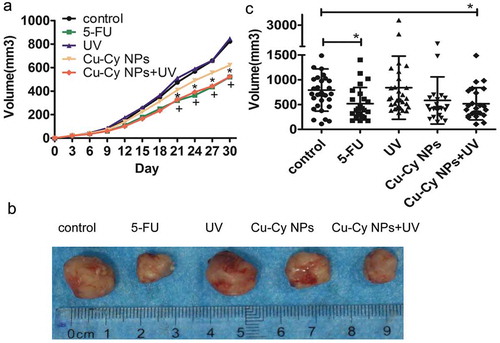
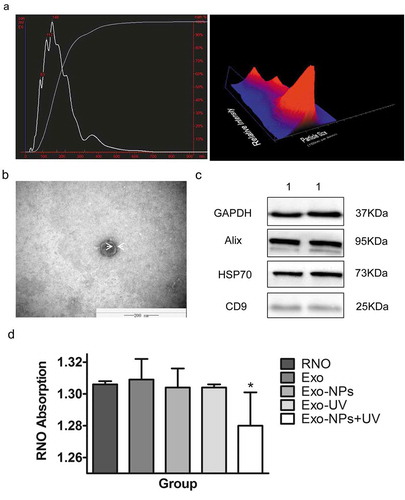
Figure 9. Identification of exosomes, and absorption of soluble Cu-Cy NPs by cells. (a) Nanosight analysis of the HepG2 exosomes. (b) TEM of HepG2 exosome. (c) The western blot of the exosomes protein: (1) Huh7 exosomes. (d) RNO absorption quenching indication of singlet oxygen production in different groups. The data are expressed as the mean ± SD of three independent experiments. *P < 0.05 compared with the control (RNO as control).