
Figures & data
Figure 1. MiR-21 promotes PCa cell proliferation and colony formation.
(a) MiR-21 expression levels in PCa tumor tissue and paired normal tissue from the TCGA PCa database. (b) MiR-21 expression level in groups of patients by Gleason score. (c) Survival analysis of patients with high or low levels of miR-21. (d) MiR-21 expression levels of androgen-dependent (LNCaP and VCaP) and androgen-independent (PC-3 and DU145) PCa cell lines. (e) MiR-21 expression levels of LNCaP, DU145, and PC-3 cells after transfection with an miR-21 mimic vector (LNCaP) or miR-21 inhibition vector (DU145 or PC-3). (f) Viability of these cells for up to 4 days was measured by CCK-8 assay. (g-i) Colony formation by LNCaP, DU145, and PC-3 cells was quantified. The small pictures were photographed at ×200 magnification under a microscope. MOCK cells were not transfected; NC indicates transfection with a negative control vector. *p < 0.05, **p < 0.01, ***p < 0.001. as compared with MOCK or corresponding control.
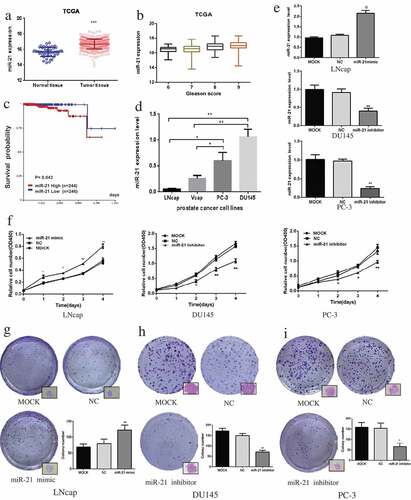
Figure 2. MiR-21 inhibits PCa cell apoptosis.
(a-f) Apoptotic rates of LNCaP, DU145, and PC-3 cells after transfection with an miR-21 mimic (LNCaP) or miR-21 inhibitor (DU145 and PC-3) were determined by flow cytometry (a, c, e) and the results quantified (b, c, f). (g-i) Expression of Bax and Bcl-2 proteins in each LNCaPcell group. β-actin was used as an internal control. Quantified results are showed under each gel image. MOCK cells were not transfected; NC indicates transfection with negative control vector. *p < 0.05, **p < 0.01 as compared with MOCK.
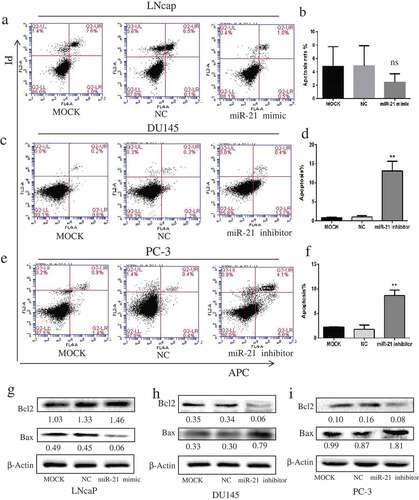
Figure 3. MiR-21 promotes PCa cell migration and invasion.
(a,b) Effect of miR-21 upregulation in LNCaP cells and miR-21 downregulation in DU145 and PC-3 cells on cell migration and invasion in a transwell chamber assay. The cells that migrated or invaded through the membrane in each assay were counted and the quantified results are shown under the images. (c-d) The migration capacity of DU145 and PC-3 cells was also determined by wound healing assay. The healing rate of cells was calculated and is shown under the images. MOCK cells were not transfected; NC indicates transfection with negative control vector. *p < 0.05, **p < 0.01, ***p < 0.01 as compared with MOCK.
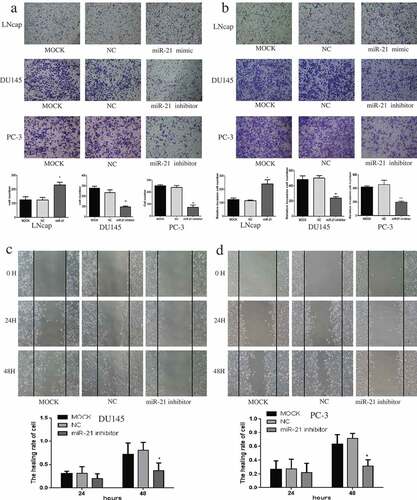
Figure 4. MiR-21 directly targets KLF5 in PCa.
(a) The targets of miR-21 as predicted by PITA, DIANA, TargetScan, and MiRTargetLink databases. (b) The TCGA PCa database (PRAD) was analyzed to determine the expression levels of the 15 target genes. (c) The correlation of miR-21 and KLF5 mRNA expression levels in the TCGA PCa database. (d-f) The effect of miR-21 level on KLF5 mRNA expression levels in LNCaP, DU145, and PC-3 cells. (g-i) The effects of miR-21 level on KLF5 protein expression levels in LNCaP, DU145, and PC-3 cells. β-actin was used as an internal control. The quantified results are shown under the KLF5 gel images. (j) The consequential pairing of the target region of KLF5 and miR-21. (k) The direct targeting by miR-21 of the 3′-UTR region of KLF5 was confirmed by Luciferase reporter assay. MOCK cells were not transfected; NC indicates transfection with negative control vector. *p < 0.05, **p < 0.01 as compared with MOCK.
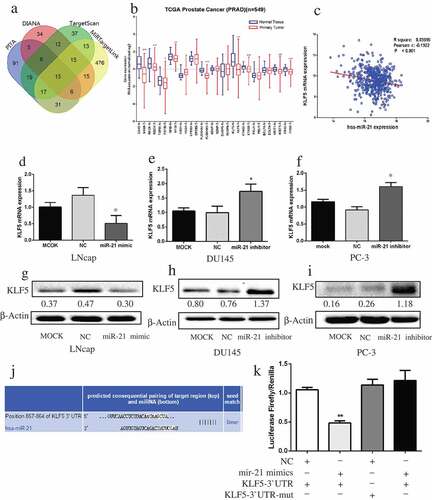
Figure 5. MiR-21 promotes GSK3B and the AKT signaling pathway.
(a) The protein-protein interaction network and functional enrichment analysis of KLF5-related proteins. (b) The expression levels of GSK3B, TP53, and KLF5 mRNA in PCa patients with various Gleason categories. (c) The correlation between GSK3B and KLF5 mRNA expression levels in the TCGA PCa database. (d) Survival analysis of patients with high or low level of GSK3B. (e-g) The effect of miR-21 level on expression levels of GSK3B, AKT, and pS473-AKT proteins in LNCaP, DU145, and PC-3 cells. MOCK cells were not transfected; NC indicates transfection with negative control vector. β-actin was used as an internal control. Quantified results are showed under each gel image. *p < 0.05 as compared with MOCK.
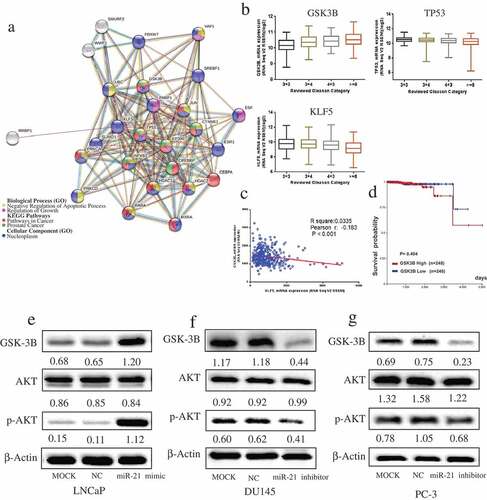
Figure 6. Downregulation of KLF5 promotes PCa carcinogenesis.
(a-b) KLF5 mRNA and protein levels in miR-21–downregulated DU145 cells after transfection with KLF5 shRNA. (c) The effect of KLF5 downregulation on viability of DU145 cells. (d) The effect of KLF5 downregulation on colony formation of DU145 cells. Colony numbers are shown at right. The images were photographed at ×200 magnification. (e) The effect of KLF5 downregulation on apoptosis of DU145 cells; apoptosis rates are shown at right. (f-g) The effect of KLF5 downregulation on DU145 cell migration and invasion; the numbers of cells are shown at right. (h) The effect of KLF5 downregulation on wound healing of DU145 cells; the healing rates are shown under the images. (i) The GSK3B, Bcl2, Bax, AKT, and pS473-AKT proteins in DU145 cells. β-actin was used as an internal control; the quantified results are showed under each gel image. (j) The effect of KLF5 downregulation on miR-21 expression in DU145 cells. *p < 0.05, **p < 0.01, ***p < 0.01, ns, not significant, as compared with cells treated with miR-21 inhibitor alone.
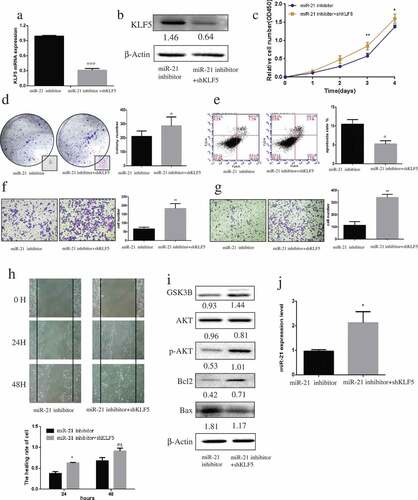
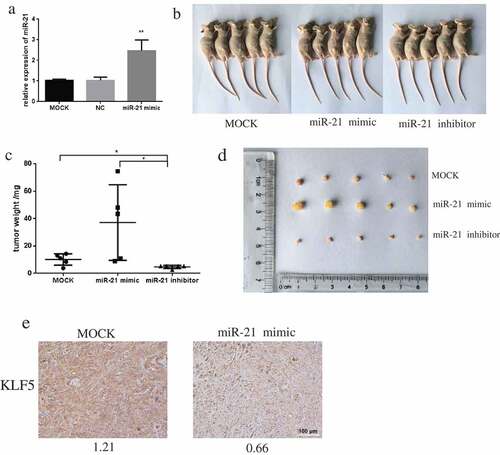
Figure 7. miR-21 promotes PCa tumor growth in xenograft mice.
(a) MiR-21 expression of DU145 cells after transfection with miR-21 mimic vector. (b-d) MiR-21 mimic, miR-21–inhibited, and MOCK tumors were successfully established in mice tumors size and weight were determined. (e) KLF5 expression in tumor tissues was determined by immunohistochemistry. The mean optical density of sections is shown under each image. MOCK cells were not transfected; NC indicates transfection with negative control vector. *p < 0.05, **p < 0.01 compared to MOCK.
Supplemental material