Figures & data
Figure 1. CAFs present in esophageal cancer tissue increase with tumor invasion depth. (a) Immunohistochemistry of an advanced case of resected esophageal squamous cell carcinoma (ESCC), in which large numbers of CAFs are located in the tumor stroma. SMA positive cells are (red arrowheads) observed both in the tumor stroma (CAFs) and at the layer of the lamina propria (red arrowheads). FAP-positive cells (orange arrowheads) are observed only in the tumor stroma (CAFs). FSP-1 positive cells (green arrowheads) are observed in the tumor stroma (CAFs) but also the stroma of the lamina propria, which is not tumor area. Scale bar, 200 μm (x100). (b–d) Microscopy shows HE and immunofluorescent (IF) double staining of αSMA and FSP1 labeled with Alexa568 (red) and Alexa488 (green), respectively. Green cells indicate normal fibroblasts, and yellow/orange cells indicate CAFs. Red cells indicate smooth muscle cells. Colored arrowheads highlight examples of these different cells in the tumor microenvironment. The nuclei were counterstained with DAPI (blue). Scale bar, 500 μm (HE), 50 μm (IF). (b) The complexity of the presence of different stromal cells is shown by IF. The dotted white line shows the tumor’s invasive front. (c) A representative early case (with submucosal [SM] invasive depth) shows several green cells (normal fibroblasts) and red cells/structures (smooth muscle layers and vessels). For CAF quantitation, three zones of the tumor invasive front for each sample were selected and the results averaged. (d) A representative advanced case (with muscularis propria [MP] invasive depth) shows several orange/yellow cells, indicating accumulation of CAFs. (e) The mean number of CAFs (±SEM) was calculated for each invasive depth (mucosa [M], n = 8; SM, n = 8; MP, n = 8); ** P< .005, one-way ANOVA with Tukey’s test. (f) IHC of FAP staining. Scale bar, 1 mm (40x), 200 μm (200x). A representative M tumor shows low FAP intensity in the tumor and its surrounding stroma. A representative SM tumor shows moderate FAP intensity in the stroma. A representative MP tumor shows strong FAP intensity in the stroma. (g) The mean score of FAP intensity (±SEM) was calculated for each invasive depth; ** P< .005, one-way ANOVA with Tukey’s test.
![Figure 1. CAFs present in esophageal cancer tissue increase with tumor invasion depth. (a) Immunohistochemistry of an advanced case of resected esophageal squamous cell carcinoma (ESCC), in which large numbers of CAFs are located in the tumor stroma. SMA positive cells are (red arrowheads) observed both in the tumor stroma (CAFs) and at the layer of the lamina propria (red arrowheads). FAP-positive cells (orange arrowheads) are observed only in the tumor stroma (CAFs). FSP-1 positive cells (green arrowheads) are observed in the tumor stroma (CAFs) but also the stroma of the lamina propria, which is not tumor area. Scale bar, 200 μm (x100). (b–d) Microscopy shows HE and immunofluorescent (IF) double staining of αSMA and FSP1 labeled with Alexa568 (red) and Alexa488 (green), respectively. Green cells indicate normal fibroblasts, and yellow/orange cells indicate CAFs. Red cells indicate smooth muscle cells. Colored arrowheads highlight examples of these different cells in the tumor microenvironment. The nuclei were counterstained with DAPI (blue). Scale bar, 500 μm (HE), 50 μm (IF). (b) The complexity of the presence of different stromal cells is shown by IF. The dotted white line shows the tumor’s invasive front. (c) A representative early case (with submucosal [SM] invasive depth) shows several green cells (normal fibroblasts) and red cells/structures (smooth muscle layers and vessels). For CAF quantitation, three zones of the tumor invasive front for each sample were selected and the results averaged. (d) A representative advanced case (with muscularis propria [MP] invasive depth) shows several orange/yellow cells, indicating accumulation of CAFs. (e) The mean number of CAFs (±SEM) was calculated for each invasive depth (mucosa [M], n = 8; SM, n = 8; MP, n = 8); ** P< .005, one-way ANOVA with Tukey’s test. (f) IHC of FAP staining. Scale bar, 1 mm (40x), 200 μm (200x). A representative M tumor shows low FAP intensity in the tumor and its surrounding stroma. A representative SM tumor shows moderate FAP intensity in the stroma. A representative MP tumor shows strong FAP intensity in the stroma. (g) The mean score of FAP intensity (±SEM) was calculated for each invasive depth; ** P< .005, one-way ANOVA with Tukey’s test.](/cms/asset/3055191e-1f74-475c-93e5-dc0b5a22aa46/kcbt_a_1617566_f0001_oc.jpg)
Figure 2. Evaluation of the contribution of activated fibroblasts to tumor growth. TE cells alone or co-cultured with either CAFTGFβ (fibroblasts activated with TGFβ) or CAFTEco (fibroblasts co-cultured with TE cells) were inoculated subcutaneously into mice. The mean tumor volume (±SEM) was calculated for each group. (a and b) TE4+CAFs tumors (n = 4) showed significant progressive growth compared with TE4 tumors alone (CAFTGFβ P= .0002; and CAFTE4co P= .0101; two-tailed Student’s t-test at 28 d); scale bar in images, 10 mm. (c and d) The same experiments were performed using TE8 cells, with the pattern of engraftment following the same trend as for TE4 (CAFTGFβ vs. TE8 alone, P= .050, n = 3; CAFTE8co vs. TE8 alone, P= .078, n = 4; two-tailed Student’s t-test at 28 d); scale bar in photographs, 10 mm. (e) Representative images of fluorescence microscopy show the presence of GFP-positive fibroblasts in tumor-bearing mice. The large pictures show the whole mouse body, with the dotted lines indicating the tumor. The small panels show sections of the tumors in greater detail. Scale bars, 10 mm (macro), 5 mm (section). Green arrowheads indicate the presence of GFP-positive fibroblasts. (f) Fluorescence microscopy detects the presence of GFP-positive fibroblasts (green arrowheads) on 7 and 21 d after initial inoculation of mice, in sectioned tumors. Scale bars, 5 mm (section).
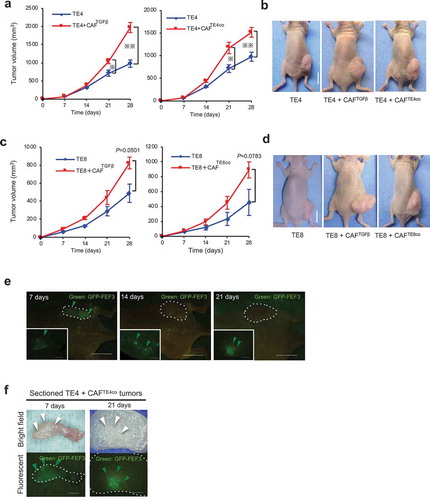
Figure 3. Pattern of αSMA and FAP expression in activated fibroblasts. (a) Western blot analysis showing the expression of αSMA and FAP over time in fibroblasts stimulated by different experimental conditions. (b and c) Quantification of western blot data (a) showing the αSMA and FAP expression relative to that of the control.
Figure 4. Activated fibroblasts express FAP on their cell surface, as determined by FACS and immunofluorescent staining. (a) Representative FACS data show significantly increased FAP expression in fibroblasts stimulated by co-culturing with TE cell lines. X-axis: intensity; Y-axis: total cell number. (b) FACS analysis shows the intensity of FAP expression over time. Each set of conditions (n = 3) was compared with untreated control. Significantly higher intensity of FAP than in the control was detected in CAFTE4co cells (P= .0014) and CAFTE4CM cells at d 6 (P= .0195). Higher intensity was detected in CAFTE4CM cells (mean, 1.35-fold, P= .2513) at d 2, CAFTE4CM (mean, 1.61-fold, P= .0623) and CAFTE8CM (mean, 1.60-fold, P= .0664) cells at d 4 and CAFTE8co (mean, 1.60-fold, P= .0554) and CAFTE8CM (mean, 1.42-fold, P= .159) cells at d 6. The arrows indicate the duration of culturing with each medium. The mean intensity (±SEM) was calculated for each group; * P< .05, ** P< .005; two-tailed Student’s t-test. (c–e) IF microscopy of fibroblasts stimulated with TGFβ or CM from TE cells for 96 h. Activated fibroblasts strongly expressed stress fibers of αSMA (red) and FAP (green) compared with the control (unstimulated) cells. Images are shown at 600× magnification. (f) FACS analysis showed reversible expression of FAP when cells were stimulated for 6 d with conditioned medium (CM) and grown for 3 d in normal medium (NM).
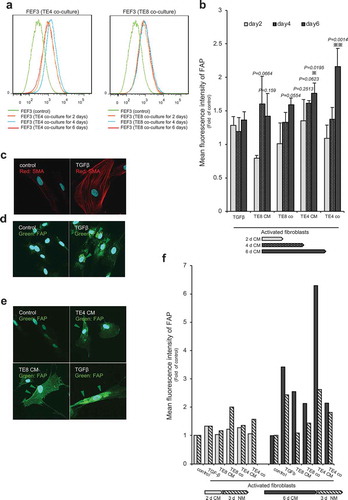
Figure 5. Long-term growth inhibition of CAFs in response to FAP-IR700-mediated NIR-PIT in vitro. (a) Microscopic images of cells before and after FAP-IR700 (10 µg/mL)-mediated NIR light (18 J/cm2). There was no NIR-PIT effect on cancer cells, whereas CAFTE4CM cells showed rapid shrinkage (indicated by red arrow) in response to NIR-PIT; scale bar, 200 μm (TE4), 100 μm (CAFTE4CM). (b) Cell viability assay (72 h after NIR-PIT) shows a limited inhibitory effect on non-activated fibroblasts, with a 23.4% reduction using 20 µg FAP-IP700 and 20 J/cm2 NIR light compared with untreated controls (mean±SEM (n = 5); P< .005, one-way ANOVA with Tukey’s test) (c) The cell viability assay shows an inhibitory effect of NIR-PIT on CAFTE4CM in a dose- and irradiation-intensity-dependent manner, evaluated 72 h after irradiation. Results for each experiment were compared with FAP-IR700 0 µg/mL. Significant inhibitory effects were revealed for the combinations of 15 J/cm2 NIR with 10 µg/mL and 20 µg/mL FAP-IR700 (n = 3). Data indicate mean ± SEM; * P< .05, ** P< .005, two-tailed Student’s t-test. (d) The mean (±SEM) irradiation-dose-dependent effect of NIR-PIT on CAFTE4CM cell viability (n = 5). NIR-PIT (20 µg of FAP-IR700) resulted in a 58.9% and 93.2% reduction in viability at 15 and 20 J/cm2 NIR, respectively, compared with no irradiation; ** P< .005, one-way ANOVA with Tukey’s test. (e) FAP-targeted NIR-PIT in each cell line resulted in a significant inhibitory effect compared with the non-NIR-PIT control. Data indicate mean ± SEM; * P< .05, ** P< .005, one-way ANOVA with Tukey’s test. (f) Microscopic observations of the response of CAFTE4CM cells to FAP-IR700-mediated NIR-PIT over time; scale bar, 100 μm. (g) Cell growth assay shows inhibition of FAP-expressing CAFs by NIR-PIT (n = 4), similar to the results from the XTT assay. There was a 60.2% reduction after 3 d of NIR irradiation with 10 µg/mL FAP-IR700. The microscopy images show a decrease in cell density following NIR-PIT in both experiments. Data indicate mean ± SEM; * P< .05, ** P< .005, two-tailed Student’s t-test. Scale bar: 100 μm. (h) Cell growth assay of CAFTE4CM shows the long-term growth inhibition effect of NIR-PIT in vitro (mean±SEM), compared with that under control conditions (FAPIR 0, NIR 0); ** P< .005, one-way ANOVA with Tukey’s test (n = 4).
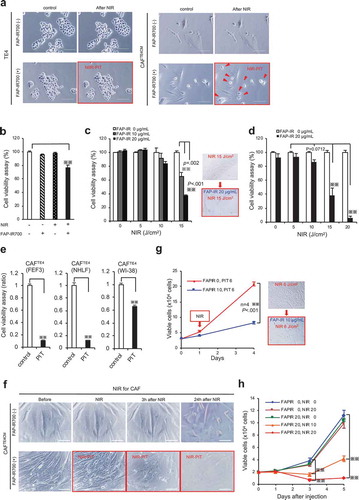
Figure 6. Targeting of CAFs with FAP-IR700-mediated NIR-PIT suppresses tumor growth in esophageal carcinoma in vivo. (a) Near-infrared (NIR) light power (mW/cm2) was measured using an optical power meter, with or without an interrupting layer of skin. NIR light through murine skin was found to be reduced by about 60%. (b) Tumors co-cultured with TE4 and CAFs (n = 5) showed significantly progressive growth compared with that of tumors in the TE4-alone group (n = 5; P= .0192 on d 21). NIR irradiation was performed on d 0 and d 3 for all groups, significantly inhibiting TE+CAF tumors (P= .0098 on d 14, P= .0025 on d 18, P= .0031 on d 21), with the rate of growth returning to the rate observed with TE4 alone; the data indicate the mean±SEM; * P< .05, ** P< .005, one-way ANOVA with Tukey’s test; NS, not significant. (c) The mean body weight (±SEM) of the animals in each treatment group (NS, not significant; one-way ANOVA with Tukey’s test). (d) Representative mice bearing tumors for each group. (e) Representative tumors for each group. (f) Co-cultured tumors treated with NIR-PIT showed significantly reduced tumor weights on d 21 (P= .0182), compared with TE4+ CAF tumors in the absence of NIR-PIT (the data indicate the mean±SEM; * P< .05, one-way ANOVA with Tukey’s test). (g and h) Tumors of TE4 (n = 6) treated by FAP-targeted NIR-PIT or NIR alone did not show significant growth inhibition compared with the control TE4 group (n = 6) on d 21. NIR irradiation was performed on d 0 and d 3 for the NIR groups (the data indicate the mean±SEM; NS, not significant; one-way ANOVA with Tukey’s test).
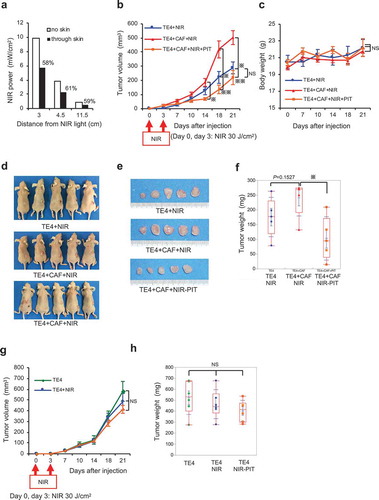
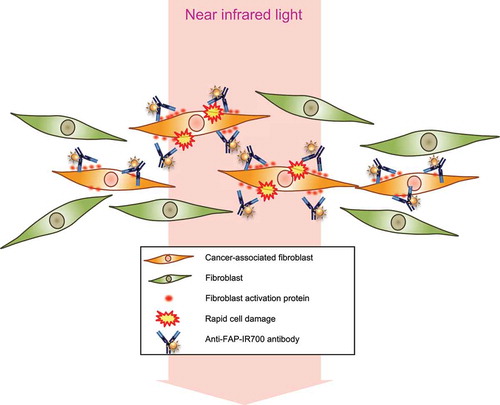
Figure 7. Schematic illustrations of PIT for CAFs.
Schematic of PIT therapy for the tumor microenvironment targeting FAP+ CAFs. FAP+ CAFs are selectively damaged by PIT.