
Figures & data
Figure 1. The proliferation of neuroblastoma cell lines in response to five commonly used chemotherapeutics. Seven different neuroblastoma cell lines were treated with various chemotherapeutic agents. The inhibitory concentrations required for 50% inhibition of proliferation (IC50) in vitro 72 hours following drug treatment were assessed as a means to compare the relative resistance of these cell lines to various chemotherapeutic agents. SK-N-AS and SK-N-BE(2) (blue and red, respectively) were generally more resistant to most drugs tested in that higher concentrations of chemotherapeutics were required for inhibition of proliferation. LAN5 and CHP134 (purple and orange) were generally more sensitive to most chemotherapeutics in that lower drug concentrations were required to inhibit proliferation. Graphs show the mean ± S.E.M. from at least three independent trials. Comparisons were made using ANOVA with post hoc Tukey test. * denotes p < .05, ** denotes p < .01, *** denotes p < .001.
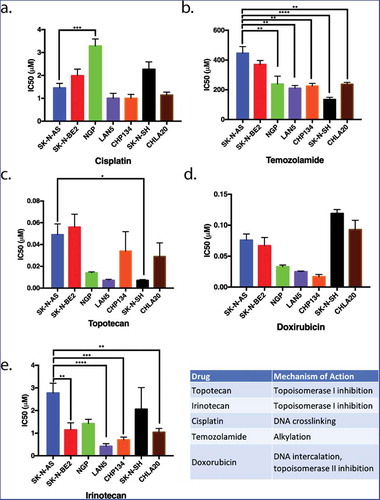
Figure 2. Depletion of UBE4B reveals an inhibitory effect of Cetuximab on neuroblastoma cell proliferation in vitro. (a) Two different shRNAs (shRNA1, shRNA2) were delivered to SK-N-AS neuroblastoma cells using lentiviruses resulting in undetectable levels of UBE4B. (b) Depletion of UBE4B resulted in a concomitant increase in EGFR as previously described (Sirisaengtaksin et. al. 2014). (c) Proliferation of parental SK-N-AS cells (blue circles) or those infected with lentivirus encoding a scrambled shRNA (red squares) or an shRNA targeting UBE4B (green triangles) was similar. However, Cetuximab significantly inhibited proliferation only when UBE4B was depleted (d) compared to parental cells and those infected with a scrambled shRNA measured using an MTT assay (n = 3). Graphs (b-d) show the mean ±/- S.E.M. from three independent trials. Comparisons were made using ANOVA with post hoc Dunnett multiple comparison test. * denotes p < .05, ** denotes p < .01, *** denotes p < .001.
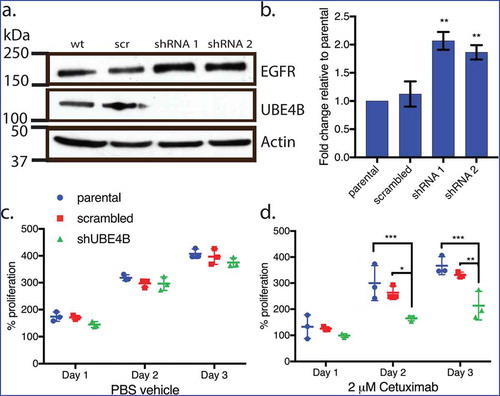
Figure 3. Reverse phase protein analysis (RPPA) was used to screen levels of 305 proteins associated with tumorgenesis in SK-N-AS cells that had been depleted of UBE4B using a UBE4B specific shRNA or SK-N-AS cells infected with a scrambled shRNA. Complete dataset showing the levels of 57 proteins that increased by two-fold or more () and 26 proteins that decreased by 50% or more (). [Please see methods for details on methodology and (https://www.mdanderson.org/research/research-resources/core-facilities/functional-proteomics-rppa-core.html)].
![Figure 3. Reverse phase protein analysis (RPPA) was used to screen levels of 305 proteins associated with tumorgenesis in SK-N-AS cells that had been depleted of UBE4B using a UBE4B specific shRNA or SK-N-AS cells infected with a scrambled shRNA. Complete dataset showing the levels of 57 proteins that increased by two-fold or more (Figure 3(a)) and 26 proteins that decreased by 50% or more (Figure 3(b)). [Please see methods for details on methodology and (https://www.mdanderson.org/research/research-resources/core-facilities/functional-proteomics-rppa-core.html)].](/cms/asset/f244e8f4-ac02-4838-a3ce-83c545d5a0ca/kcbt_a_1647049_f0003_oc.jpg)
Figure 4. Reverse Phase Protein Array (RPPA) was used to quantitatively measure changes in levels of 305 cancer-associated proteins following UBE4B depletion in neuroblastoma SK-N-AS cells. Protein levels were either increased (a) or decreased (b) relative to parental SK-N-AS or SK-N-AS cells infected with a scrambled shRNA. A positive control (EGFR) was included in the analysis and its levels were increased as previously described (Sirisaengtaksin et al 2014; and see STAT5a, increased in levels according to the RPPA analysis (a) and this increase was confirmed with quantitative immunoblotting in UBE4B-depleted SK-N-AS cells (c-d). (n = 3). D. Graph shows the mean ±/- S.E.M. Comparisons were made using ANOVA with post hoc Dunnett multiple comparison test. ** denotes p < .01.
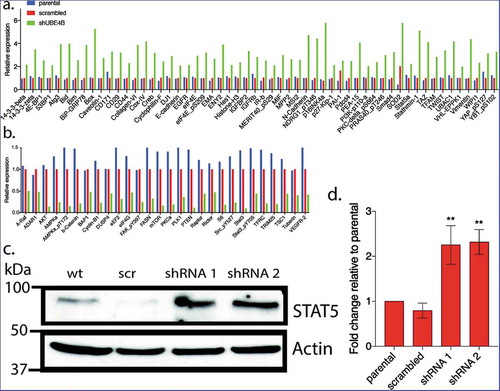
Figure 5. Proliferation of wild type, scrambled, and UBE4B-depleted SK-N-AS neuroblastoma cells measured following treatment with either (a) Cetuximab alone, (c) Erlotinib alone, (b) a combination of Cetuximab with the STAT5 inhibitor, SH-4-54 (d) or a combination of Erlotinib with SH-4-54. Controls included treatment with the vehicle alone (e) or the STAT5 inhibitor SH-4-54 (f). Proliferation was assessed using an MTT assay every 24 hrs for 72 hrs. Percent proliferation is determined by dividing absorbance at day 1, 2, or 3 by the absorbance taken at day 0 (prior to drug administration) (n = 3). All data points and the mean ± S.E.M. are displayed for each time point and reflect the average of three independent trials. Comparisons were made using ANOVA with post hoc Dunnett multiple comparison test. * denotes p < .05, ** denotes p < .01, *** denotes p < .001.
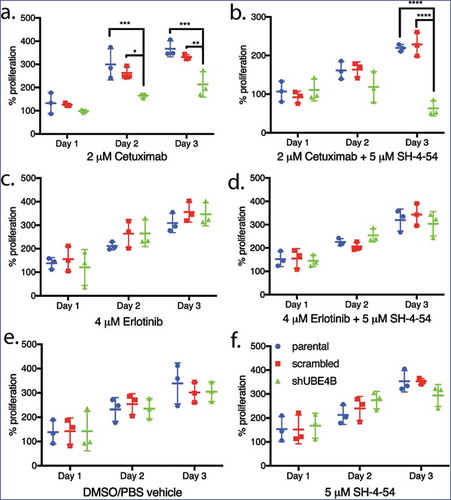
Figure 6. Depletion of UBE4B reveals an enhanced inhibitory effect of the combination of Cetuximab and SH-4-54 on the proliferation of SK-N-AS cells. SK-N-AS cells were treated with either vehicle, Cetuximab, SH-4-54, or Cetuximab+SH-4-54 and proliferation was assessed 72 hours following treatment initiation. Cetuximab (2μM) alone (green bars) significantly decreased proliferation only in cells that were depleted of UBE4B. Cetuximab did not significantly alter cell proliferation in parental cells or those infected with a lentivirus containing a scrambled shRNA (green bars). SH-4-54 did not alter SK-N-AS cell proliferation (red bars). Cetuximab inhibited SK-N-AS cell proliferation only when UBE4B was depleted (green bars). Treatment of SK-N-AS cells with a combination of Cetuximab and SH-4-54 significantly decreased proliferation in parental, scrambled, and UBE4B-depleted cells compared to cells treated with Cetuximab alone (purple bars). The antiproliferative effect of Cetuximab + SH-4-54 was significantly enhanced in UBE4B-depleted cells compared to parental cells or parental cells infected with lentivirus encoding a scrambled shRNA (purple bars, upper most comparison bar). All data points and the mean ± S.E.M. are displayed for each time point and reflect data collected from three independent trials. Comparisons were made using ANOVA with post hoc Dunnett multiple comparison test. * denotes p < .05, ** denotes p < .01, *** denotes p < .001.
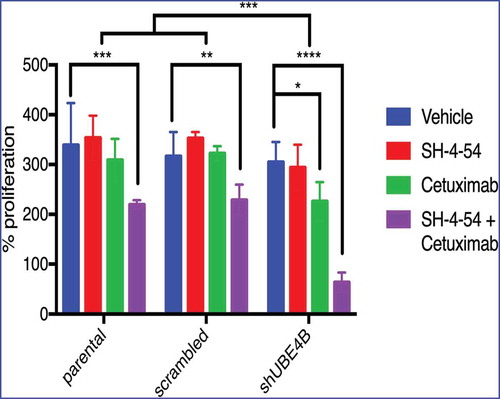
Figure 7. The migration of UBE4B-depleted SK-N-AS neuroblastoma cells is inhibited when treated with a combination of the STAT5 inhibitor SH-4-54 and Cetuximab. Cells were pretreated for 24 hours with the PBS/DMSO vehicle control (blue bars), SH-4-54 alone (red bars), Cetuximab alone (green bars), or a combination of SH-4-54 and Cetuximab (purple bars). Cells were seeded on the top surface of transwell membranes submerged in media supplemented with EGF. Membranes containing SK-N-AS cells were incubated for 24 hours in the presence of their respective drug treatment at 37°C. Membranes were then washed, fixed, and stained with DAPI to visualize migratory cells (a) which were then quantified by counting cells visible in a high-power field at 10x magnification and averaging at least three fields per condition (b) (n = 3). The antimigratory effect of Cetuximab+SH-4-54 was significantly enhanced in UBE4B-depleted cells compared to parental cells or parental cells infected with lentivirus encoding a scrambled shRNA (purple bars, top two upper most comparison bars). The mean ± S.E.M. are displayed for each condition and reflect data collected from three independent trials. Comparisons were made using ANOVA with post hoc Dunnett multiple comparison test. * denotes p < .05, ** denotes p < .01, *** denotes p < .001.
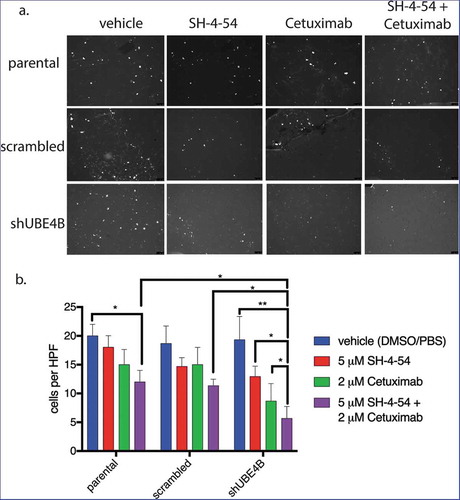
Figure 8. Apoptosis of SK-N-AS neuroblastoma cells is enhanced by treatment with Cetuximab and SH-4-54. Parental SK-N-AS cells, SK-N-AS cells infected with a scrambled shRNA, or SK-N-AS cells depleted of UBE4B, were treated with vehicle (blue bars), SH-4-54 (5 μM, red bars) Cetuximab (2 μM, green bars), or a combination of Cetuximab and SH-4-54 (purple bars). Caspase-3/7 activity was assessed with CellEvent detection reagent and phase contrast microscopy to quantify cell numbers. Percent apoptotic cells (the ratio of fluorescent cells/total cell count) was significantly greater in UBE4B-depleted and parental cells treated with the drug combination compared to SK-N-AS cells treated with vehicle, or cells treated with either Cetuximab or SH-4-54 alone. The mean ±S.E.M. is displayed for each condition and reflects data collected from three independent trials. Comparisons were made using ANOVA with post hoc Dunnett multiple comparison test. * denotes p < .05, ** denotes p < .01, *** denotes p < .001.
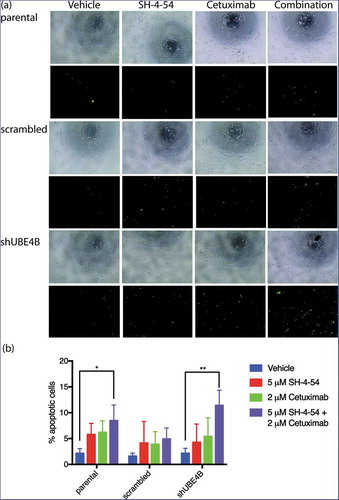
Table 1. shDNA sequences used for depleting UBE4B in neuroblastoma cell lines (Sigma Mission shRNA).