Figures & data
Figure 1. BMSCs contribute to erlotinib resistance in lung cancer cells in hypoxia. (a) Erlotinib inhibited the proliferation of A549, H358, H460 cell lines and LLC cells in a dose-dependent manner. (b) Co-culture with BMSCs increased lung cancer cell growth after treatment of erlotinib in hypoxic conditions. (c) Media collected from hypoxic BMSCs increased cancer cell growth after treatment of erlotinib.CCK-8 cell viability assay was performed to evaluate cell viability after treatment of erlotinib. Results are presented as the median of three independent experiments (**p < .01, ***p < .001, Student’s t test). (d) BMSCs promoted erlotinib resistance in syngeneic mouse lung cancer model. LLC cells with or without BMSCs were injected subcutaneously into C57BL/6 mice. When the tumor reached approximately 250–300 mm3, the mice were treated with erlotinib. Tumors excised from the mice are shown. (e) Tumor growth curve presenting in tumor volume. Each bar represents the mean tumor volume with 95% confidence intervals. Tumors were measured every 2 days. Results are presented as the median of three independent experiments (*p < .05, **p < .01, Student’s t test). (f) Immunofluorescence analysis of ki67 in tumors. Upper: tumors from mice receiving co-injection of BMSCs and LLC; lower: tumors from mice receiving injection of LLC alone. Red dots indicate the ki67 positive cells. The amplifications were presented. (g) Scatter plot of the observed expression scores of ki67. Expression was scored semi-quantitatively by positive area.
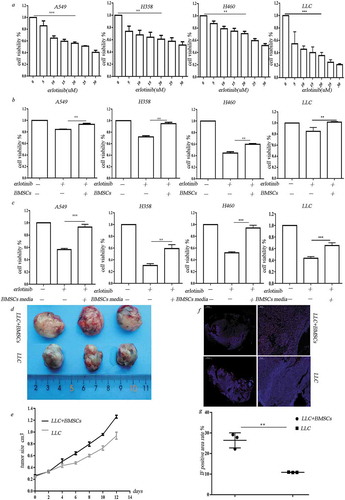
Figure 2. Adipocyte-associated cytokines secreted from BMSCs under hypoxia. (a) Adipokine array profiling. Determination of expression was based on a comparison of the captured antibody of interest to the positive controls. The signals were captured and the intensity of the dots was quantified using a Bio-Rad ChemiDoc XRS system (Bio-Rad, CA, USA). The resulting images were analyzed using Image J to measure the expression of various targets. A positive control was used to normalize the results from the different membranes being compared. To compare the signal intensities, the relative expression levels are shown below. 1. TGF-β; 2. TSG-14; 3. leptin; 4. CFD; 5. IGFBP2; 6.TNF-α; 7. IGFBP-3; 8. TGFBP-4. (b) Real-time PCR analysis for gene expression in hypoxic BMSCs (*p < .05, **p < .01, Student’s t test). (c) Western blot analysis for protein expression in hypoxic BMSCs. (d) Real-time PCR analysis for gene expression in tumors formed in mice receiving co-injection with BMSCs or LLC injection alone (*p < .05, **p < .01, Student’s t test). (e) IHC analysis of leptin in tumors. (f) Expression of leptin in stromal cells was scored semi-quantitatively.
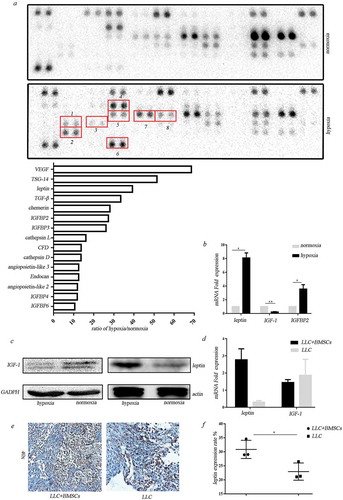
Figure 3. Leptin mediated erlotinib resistance in lung cancer cells. (a) Treatment of leptin increased erlotinib resistance in lung cancer cell A549, H358 and H460. Betulinic acid which inhibits lipogenesis reverses the erlotinib resistance mediated by leptin.(b) Leptin increased cancer cell growth in a dose-dependent manner after treatment of erlotinib.CCK-8 cell viability assay was performed to evaluate cell viability after treatment of erlotinib. Results are presented as the median of three independent experiments (*p < .05, **p < .01, Student’s t test). (c) Treatment of leptin increased clonogenic potential after treatment of erlotinib. (d) Transfection of leptin-siRNAs which block the expression of leptin in BMSCs or addition of leptin neutralizing antibody before treatment of hypoxia enhanced erlotinib-induced cytotoxicity in lung cancer cells. Results are presented as the median of three independent experiments (*p < .05, **p < .01, Student’s t test).(e) Leptin promoted erlotinib resistance in syngeneic mouse lung cancer model. The tumor-bearing mice with co-injection of LLC and BMSCs were treated with erlotinib with or without leptin antibody. The inhibition of leptin with neutralizing antibody sensitized lung cancer cells to erlotinib. Tumors excised from the mice are shown. (f) Tumor growth curve presenting in tumor volume. Each bar represents the mean tumor volume with 95% confidence intervals. Tumors were measured every 2 days. Results are presented as the median of three independent experiments (*p < .05, **p < .01, Student’s t test).
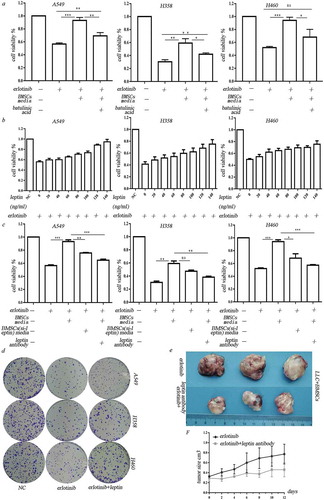
Figure 4. Leptin increased erlotinib resistance in lung cancer cells by activating IGF-1R signaling in hypoxia. (a) IGF-1R inhibitor BMS-754807 could significantly reverse the erlotinib resistance mediated by leptin. (b) Western blot analysis of IGF-1R phosphorylation and downstream MEK/ERK and AKT signaling induced by leptin. (c) Transfection of IGF-1R-siRNA in lung cancer cells before treatment of leptin resulted in the sensitization of lung cancer cells to erlotinib. (d) Leptin increased the growth of erlotinib-treated lung cancer cells in the absence of IGF-1. (e) IGFBP2 could counteract the effect of IGF-1 on the erlotinib resistance. (f) IGFBP2 promoted the lung cancer cell growth after treatment of erlotinib in IGF-1 independent through activating IGF-1R signaling. CCK-8 cell viability assay was performed to evaluate cell viability after treatment of erlotinib. Results are presented as the median of three independent experiments (*p < .05, **p < .01, Student’s t test).
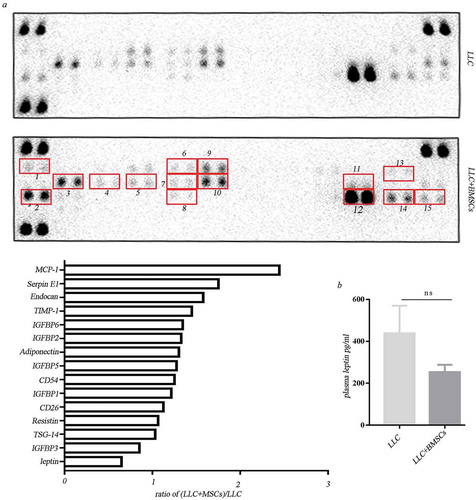
Figure 5. Leptin exerted function locally but not systemically. (a) Adipokine array profiling. Determination of expression was based on a comparison of the captured antibody of interest to the positive controls. The signals were captured and the intensity of the dots was quantified using a Bio-Rad ChemiDoc XRS system (Bio-Rad, CA, USA). The resulting images were analyzed using Image J to measure the expression of various targets. A positive control was used to normalize the results from the different membranes being compared. To compare the signal intensities, the relative expression levels are shown below. 1. Adiponectin; 2. CD26/DPP4; 3. Endocan; 4.CD54; 5.IGFBP-1; 6.IGFBP-2; 7. IGFBP-5; 8.TSG-14; 9. IGFBP-3; 10. IGFBP-6; 11. Leptin; 12. Resistin; 13. MCP-1; 14. SerpinE; 15. TIMP-1. (b) Elisa analysis of plasma leptin in mice receiving LLC injection alone or the co-injection with LLC and MSCs.