Figures & data
Figure 1. EZH2 expression in human endometrial cancers. (a) Representative image of human endometrial cancer with low, intermediate, or high EZH2 expression based on immunohistochemical staining. (b) Kaplan-Meier survival curve for endometrial carcinomas patients with low, intermediate, or high level of EZH2. Log-rank test was used to compare differences among the three groups. Increased EZH2 expression was significantly associated with decreased overall survival and disease-free survival (p < .001 for both).
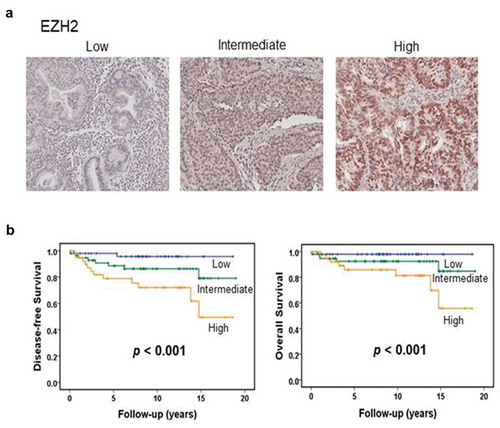
Figure 2. In vitro effect of EZH2 silencing combined with chemotherapy on cell viability. (a), MTT cell viability assay of Ishikawa, Hec-1A, and KLE cells. Cell viability was assessed at 72 hours after chemotherapy (b), Clonogenic assay of Ishikawa, Hec-1A, and KLE cells. After the siRNA transfection, cells were treated with chemotherapy for 48 yours. Number of colonies were evaluated 7–14 days later. Δ indicates a synergistic effect of chemotherapy and EZH2 silencing (CI < 1). Error bars represented SEM; *, p < .05.
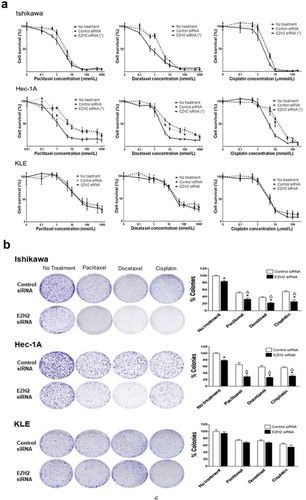
Figure 3. Effects of EZH2 silencing on tumor cell apoptosis and cell invasion in vitro. The apoptotic rate after EZH2 siRNA treatment alone (a) or in combination with cytotoxic chemotherapy (b) on Ishikawa, Hec-1A, and KLE cells. Apoptosis was measured by determining the percentage of PE Annexin V/7-AAD positive cell at 72 hours after treatment. (c) The number of cells invaded after EZH2 silencing on Ishikawa and Hec-1A cells. Error bars represented SEM; *, p < .05.
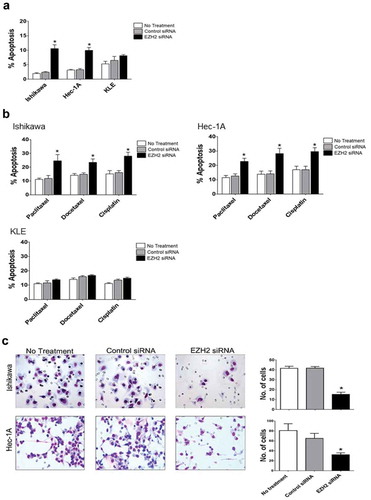
Figure 4. In vivo therapeutic and biological effects of EZH2 silencing on endometrial cancer. Mice inoculated with Hec-1A, or Ishikawa cells received siRNA/CN (control, human, mouse, or mixed EZH2) alone (a) or in combination with chemotherapy (b) at two weeks after cell line injection. Animals from all groups were euthanized when control animals became moribund. All tumors were harvested. Columns are mean tumor weights for each group. In vivo effect of EZH2 silencing on tumor cell proliferation (Ki67), angiogenesis (CD31), and apoptosis (TUNEL) by EZH2 siRNA/CN treatment alone (c) or in combination with chemotherapy (d). Immunohistochemical staining was performed for Hec-1A cell bearing mice. Error bars represent SEM. *, p < .05 compared to control siRNA/CN. **, p < .05 between connected bars.
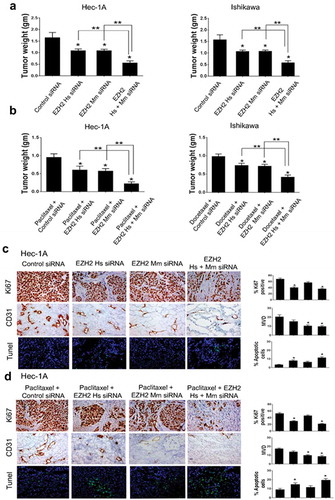
Figure 5. Differentially expressed genes between control siRNA and EZH2 siRNA treated SKOV3-ip1 and Hec-1A cells. (a) Hierarchical clustering of gene expression data from of SKOV3 and HEC-1A cells treated with siRNA. Genes with at least 1.5-fold difference in expression level relative to the median value were selected for hierarchical clustering analysis (647 genes for SKOV3 and 1452 genes for HEC-1A). Data are presented in a matrix format, with rows representing individual gene and columns representing each sample. Each cell in the matrix represents the expression level of a gene feature in an individual sample. Red and green colors in cells reflect the relative high and low expression levels, respectively, as indicated in the scale bar (log 2 transformed scale). (b) Cross comparison of gene lists from two independent statistical tests. Venn diagrams of genes selected by univariate test with multivariate permutation test (10,000 random permutations). Red circle represents genes differentially expressed in ovarian cancer cell experiment. Blue circle represents genes differentially expressed in endometrial cancer cell experiment. We applied a cutoff p-value of less than 0.001 to retain genes whose expression in significantly different between the two groups of cells examined. (c) Expression pattern of selected 32 genes in the Venn diagram. (d) Gene network analysis of the 32 genes. Up- and down- regulated genes in EZH2 silenced cells are indicated by red and green color, respectively. Dotted lines and arrows represent the direction of transcriptional regulation. Solid lines represent known physical interactions between genes connected.
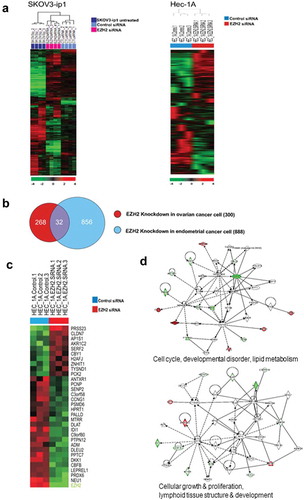
Figure 6. (a) Effect of EZH2 silencing on Hec-1A cells. After silencing of EZH2, Hec-1A cell lysate was analyzed by western blot for PRDX6 and caspases 3, 8, 9, and 10 activities. (b) Effect of EZH2 silencing on ROS levels in Hec-1A and Ishikawa cells. After EZH2 silencing alone or in combination with CDDP treatment, intracellular hydrogen peroxide and superoxide levels were measured by staining with DCF-DA and DHE, respectively. Mean DCF and DHE fluorescence were graphed and compared with controls to estimate changes of ROS levels caused by EZH2 silencing. Error bars represent SEM.